

🔍 tap to enlarge
entry
29,880
stop
29,852.5
target
29,935.5
R:R
1:2.0
Price reversed near the end of the ORD after failing to break lower and rejecting the downside move. It then consolidated as I waited for momentum confirmation. Higher time frame (HTF) indicated an ov…
A+11 reviews · 100% A+
Sign in to grade

🔍 tap to enlarge
entry
29,938
stop
29,914.5
target
30,003
R:R
1:2.8
HTF confirms price is moving away from the EMAs, supporting bullish momentum. Price initially tapped the ORB breakout level and rejected, but momentum remained strong enough to break through the ORD z…
Be the first to grade
Sign in to grade

🔍 tap to enlarge
entry
4,515.7
stop
4,518.7
target
4,509.2
R:R
1:2.2
High probability supply zone was tapped into. EMAs were stacked in my favor. Entry at the close of candle that broke the 13ema. Stop loss was placed above the candle that broke the ema and take profit…
A+11 reviews · 100% A+
Sign in to grade
73d ago
AI score
62
🔍 tap to enlarge
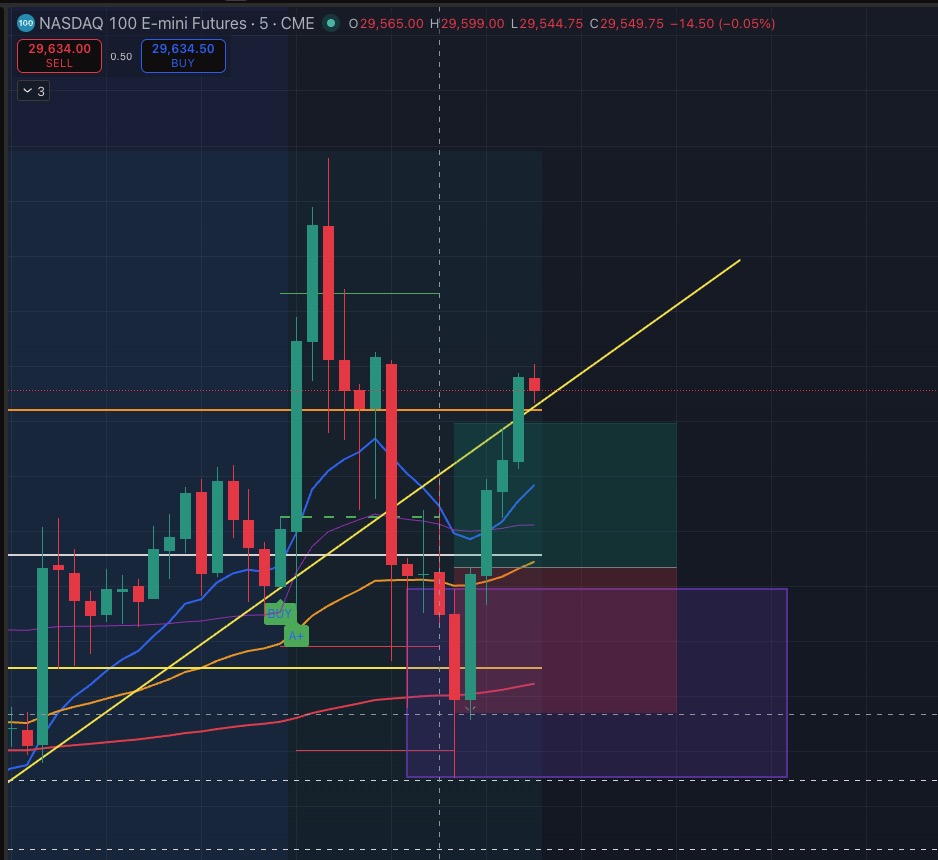
entry
29,566.6
stop
29,514.75
target
29,620
R:R
1:1.0
Demand zone marked at range 29559-29490. Confirmed at HTF that we are overall uptrend and above the EMAs. Got in at the break and retest of the green candle after demand zone has been formed. Used re…
Be the first to grade
Sign in to grade
🔍 tap to enlarge
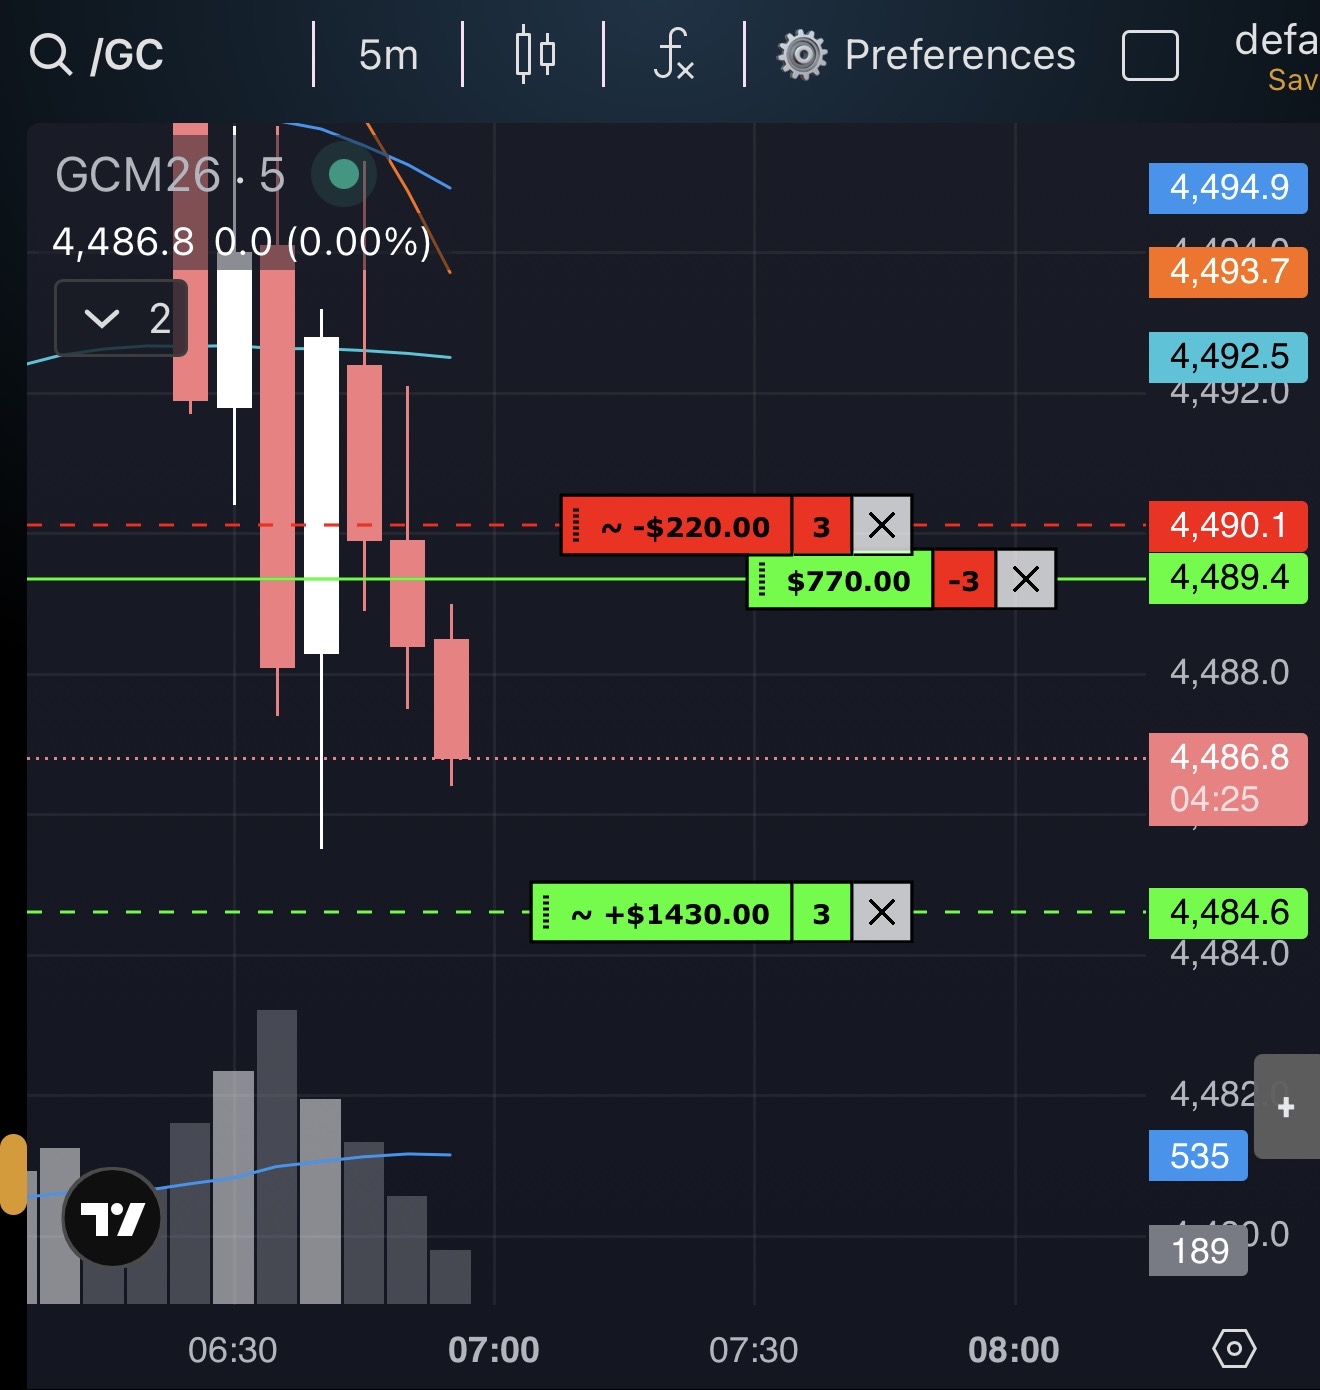
entry
4,489.4
stop
4,490.1
target
4,484.6
R:R
1:6.9
EMA death cross. 5min downtrend as price just broke previous lower highs. Targeted the closes support zone. 15 min was still in a uptrend so this was countertrend on the htfs.
Be the first to grade
Sign in to grade
🔍 tap to enlarge
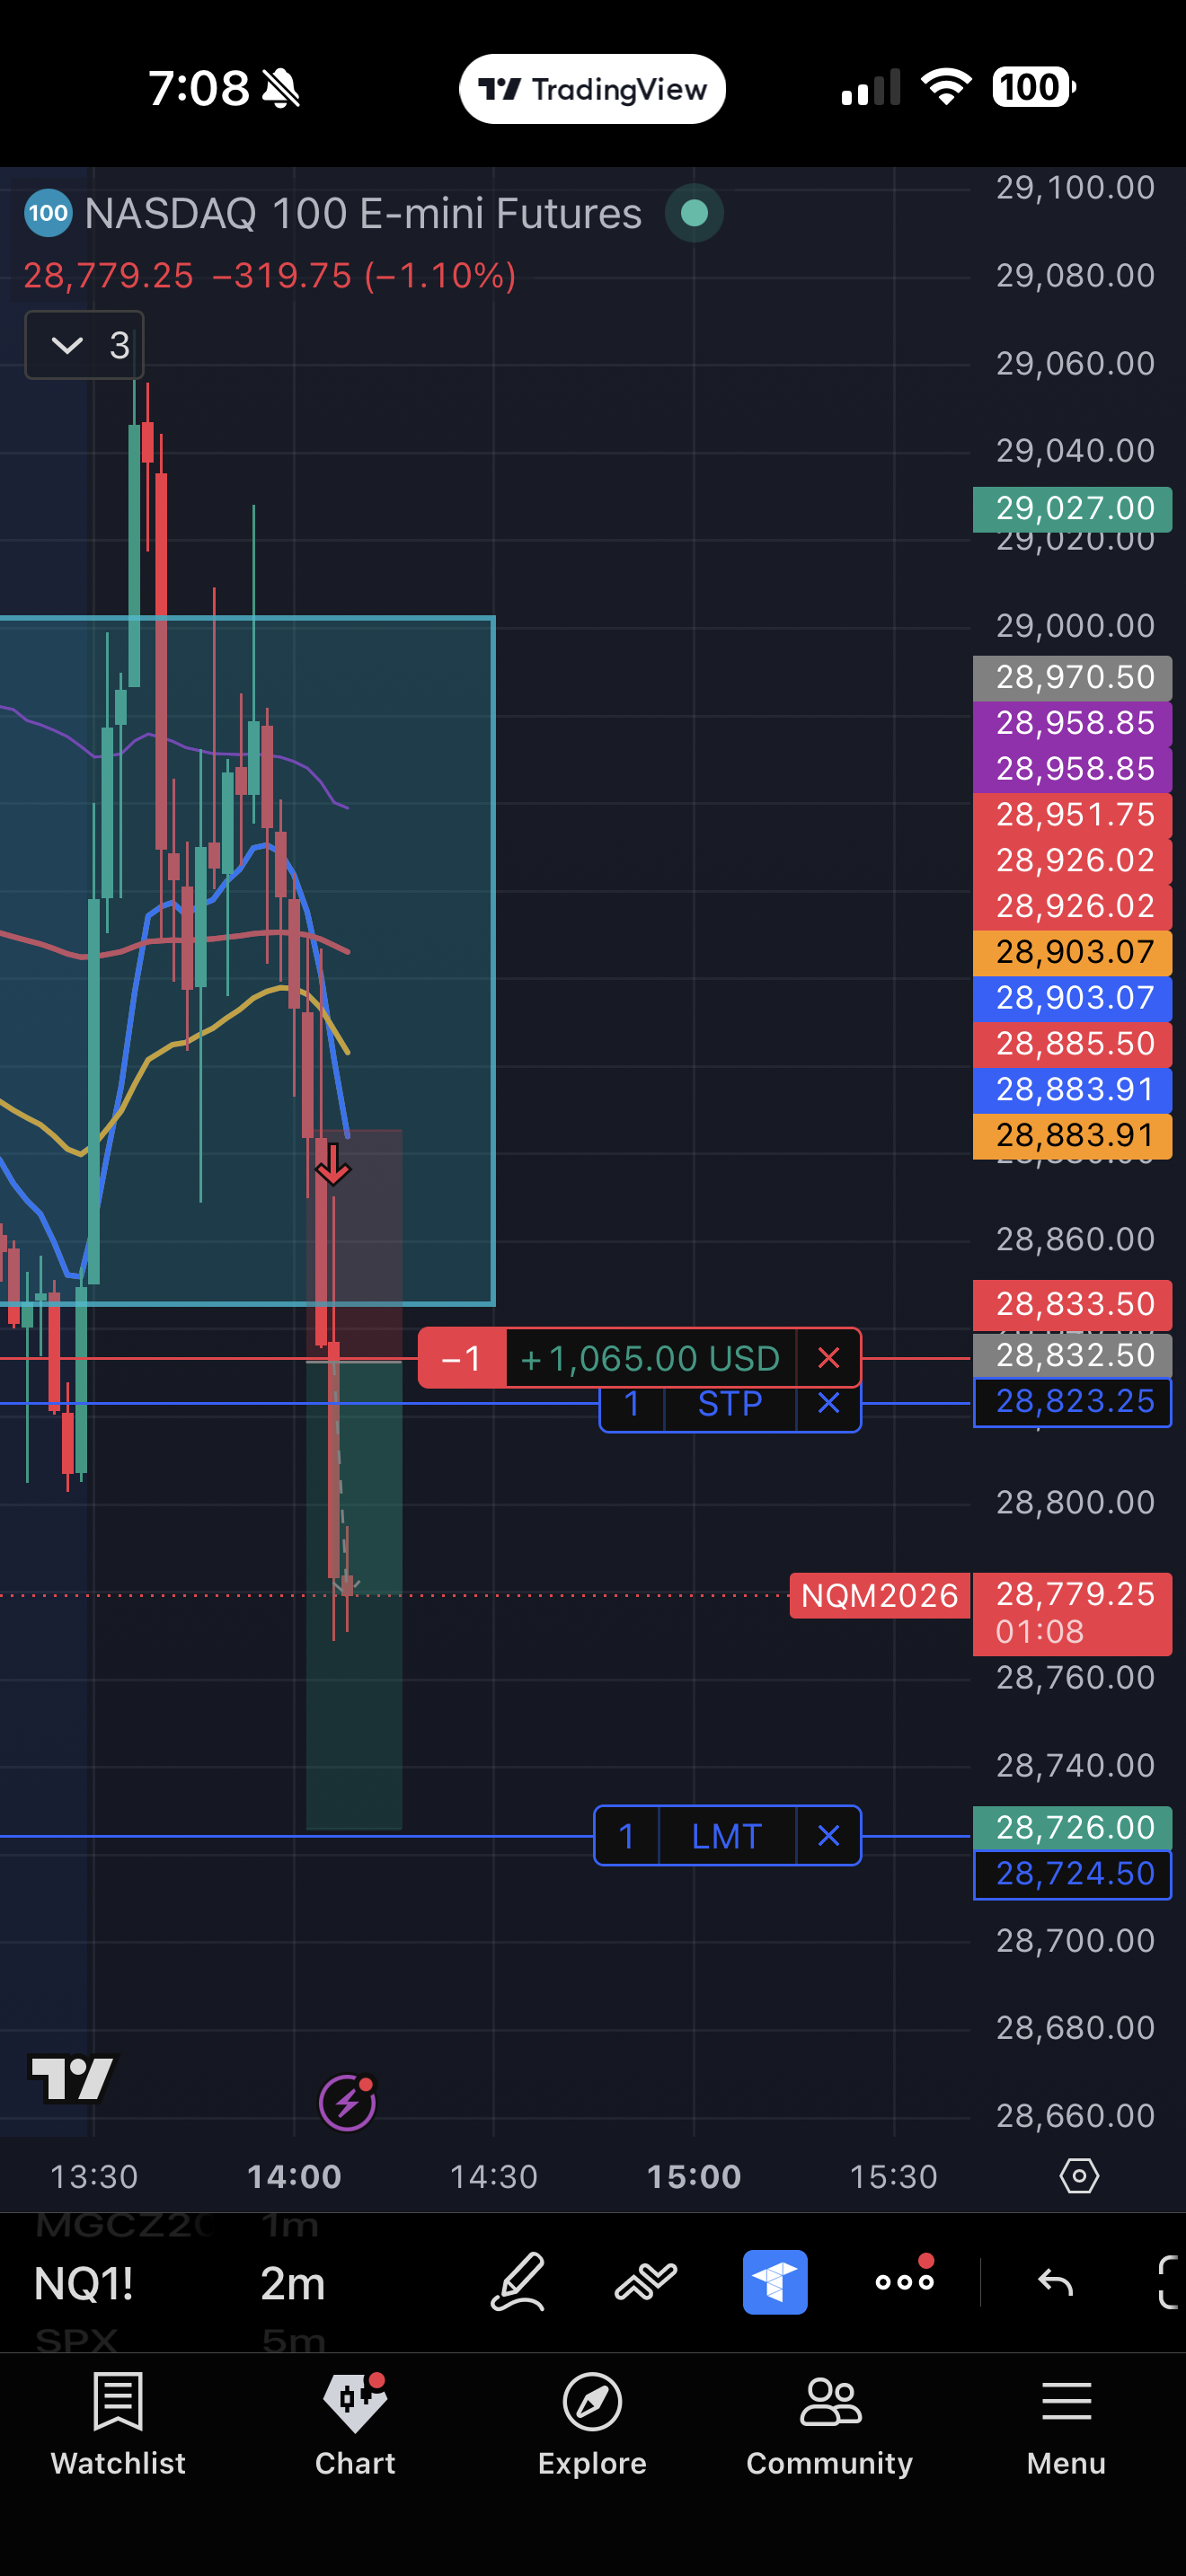
entry
28,832
stop
28,883.91
target
28,726
R:R
1:2.0
NQ was overall trending bearish on the HTF while rallying within the ORD range during the first 30 after market open. Price showed resistance around 29000–29060 and formed a double-top pattern, signal…
Be the first to grade
Sign in to grade
🔍 tap to enlarge
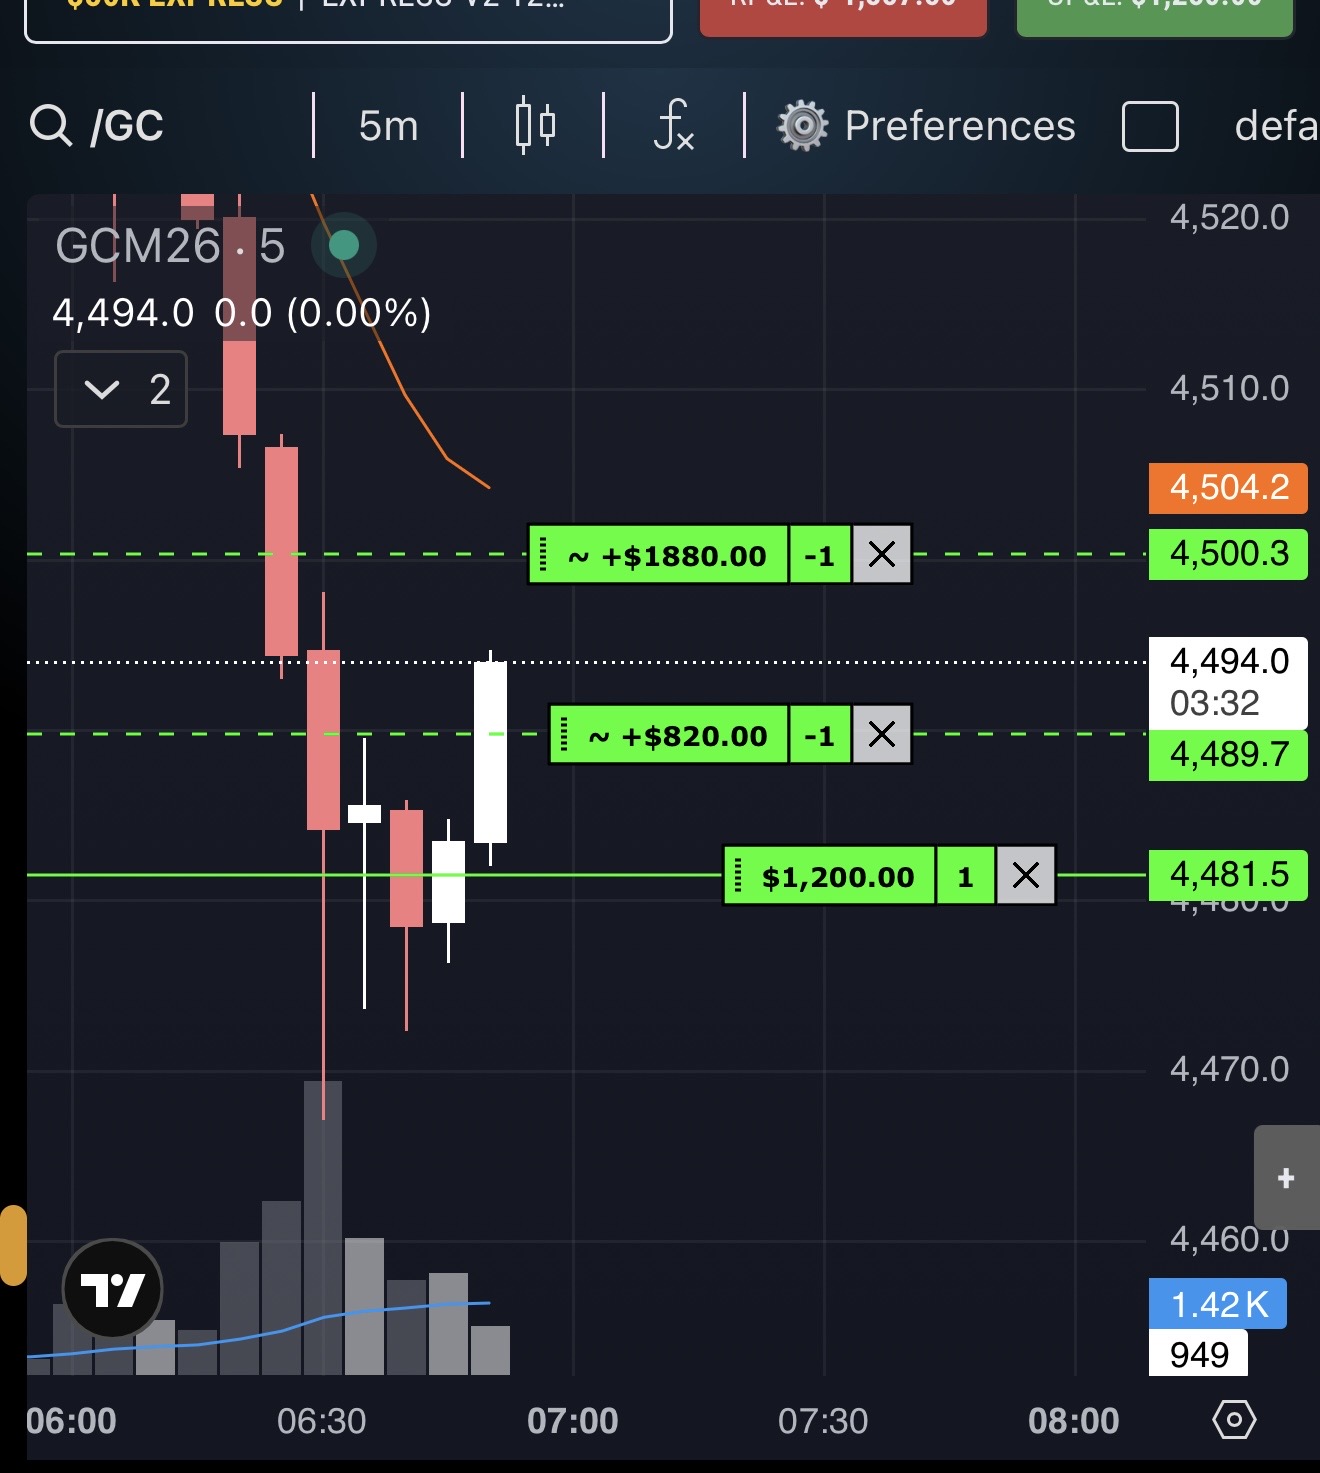
entry
4,481.5
stop
4,489.7
target
4,500.3
R:R
1:2.3
Countertrend trade strong volume and momentum to the upside. Noticed a pivot point jumped in for a quick scalped. Managed trade by trailing stop loss to break even and kept trailing stop to be in prof…
B11 reviews · 100% B
Sign in to grade
🔍 tap to enlarge
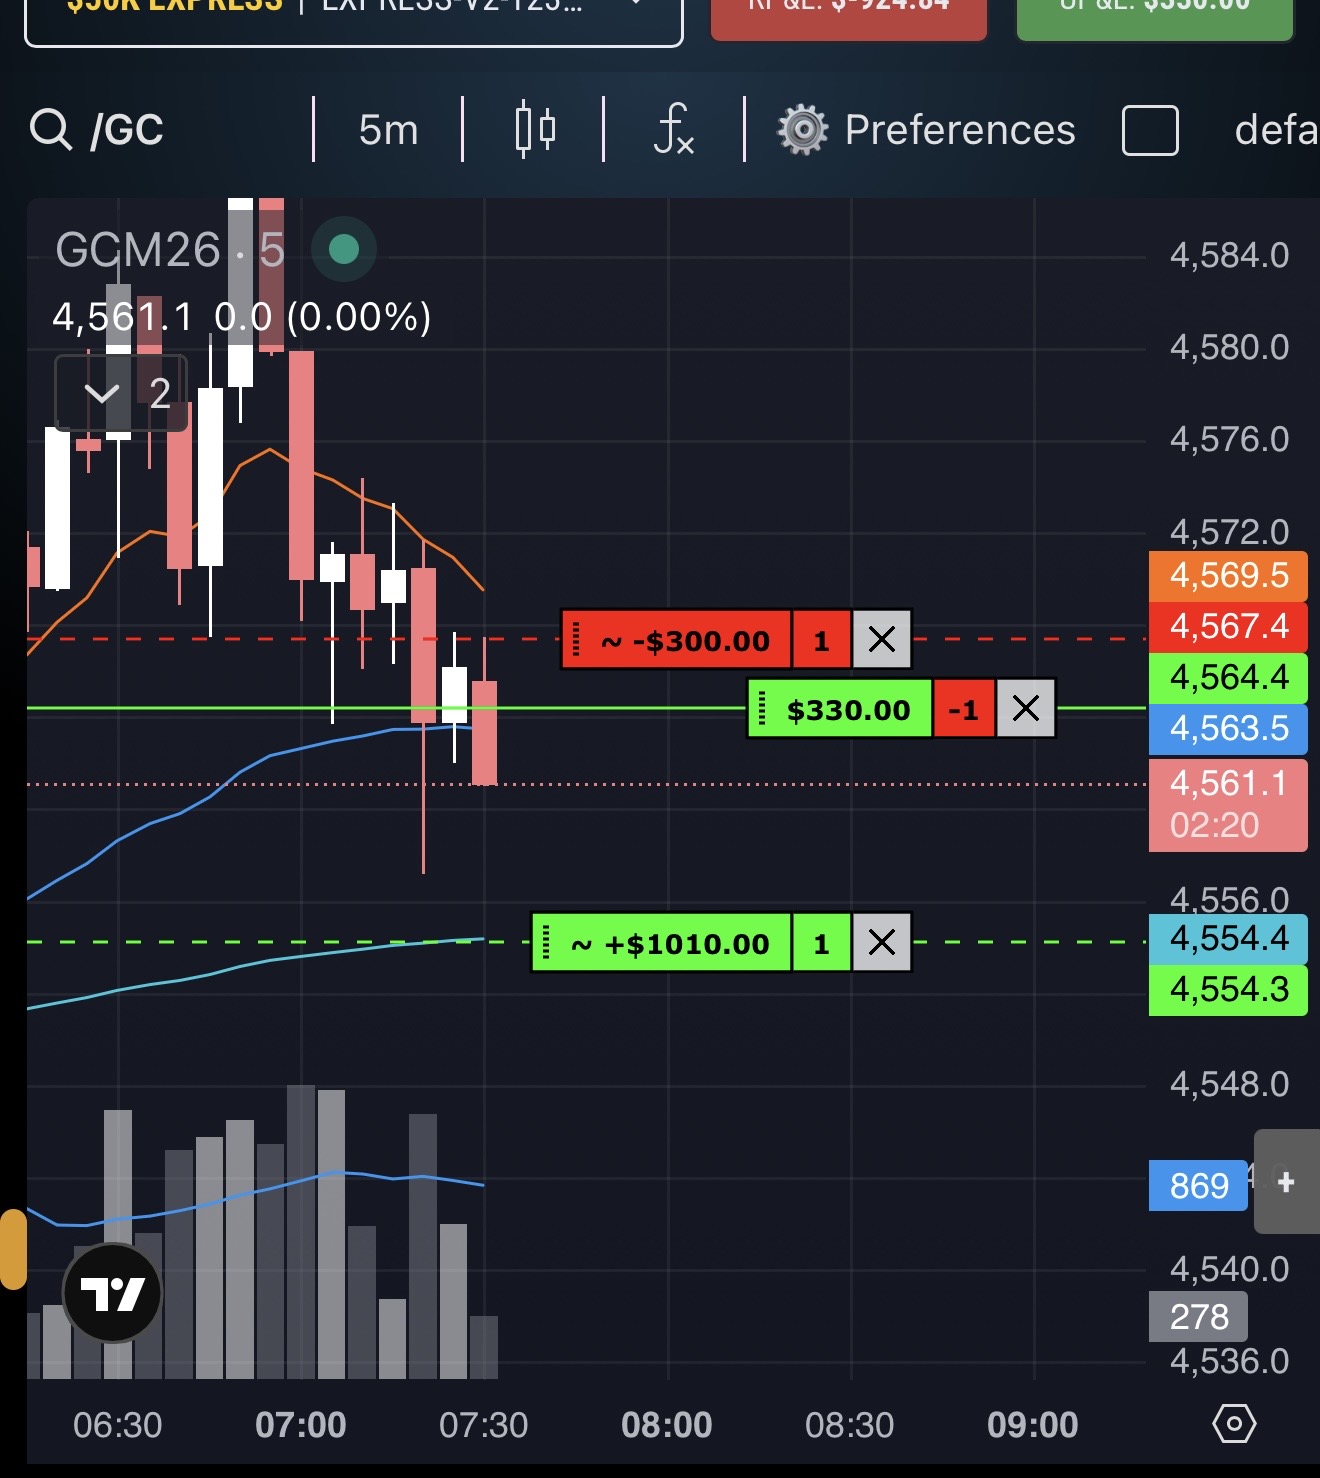
entry
4,564.4
stop
4,567.4
target
4,554.3
R:R
1:3.4
Change in the state of delivery. Entered for a 50ema breakout stop loss placed above the candle that broke the Ema. Target the nearest support for a 1:3. 15m was in a downtrend.
Be the first to grade
Sign in to grade
🔍 tap to enlarge
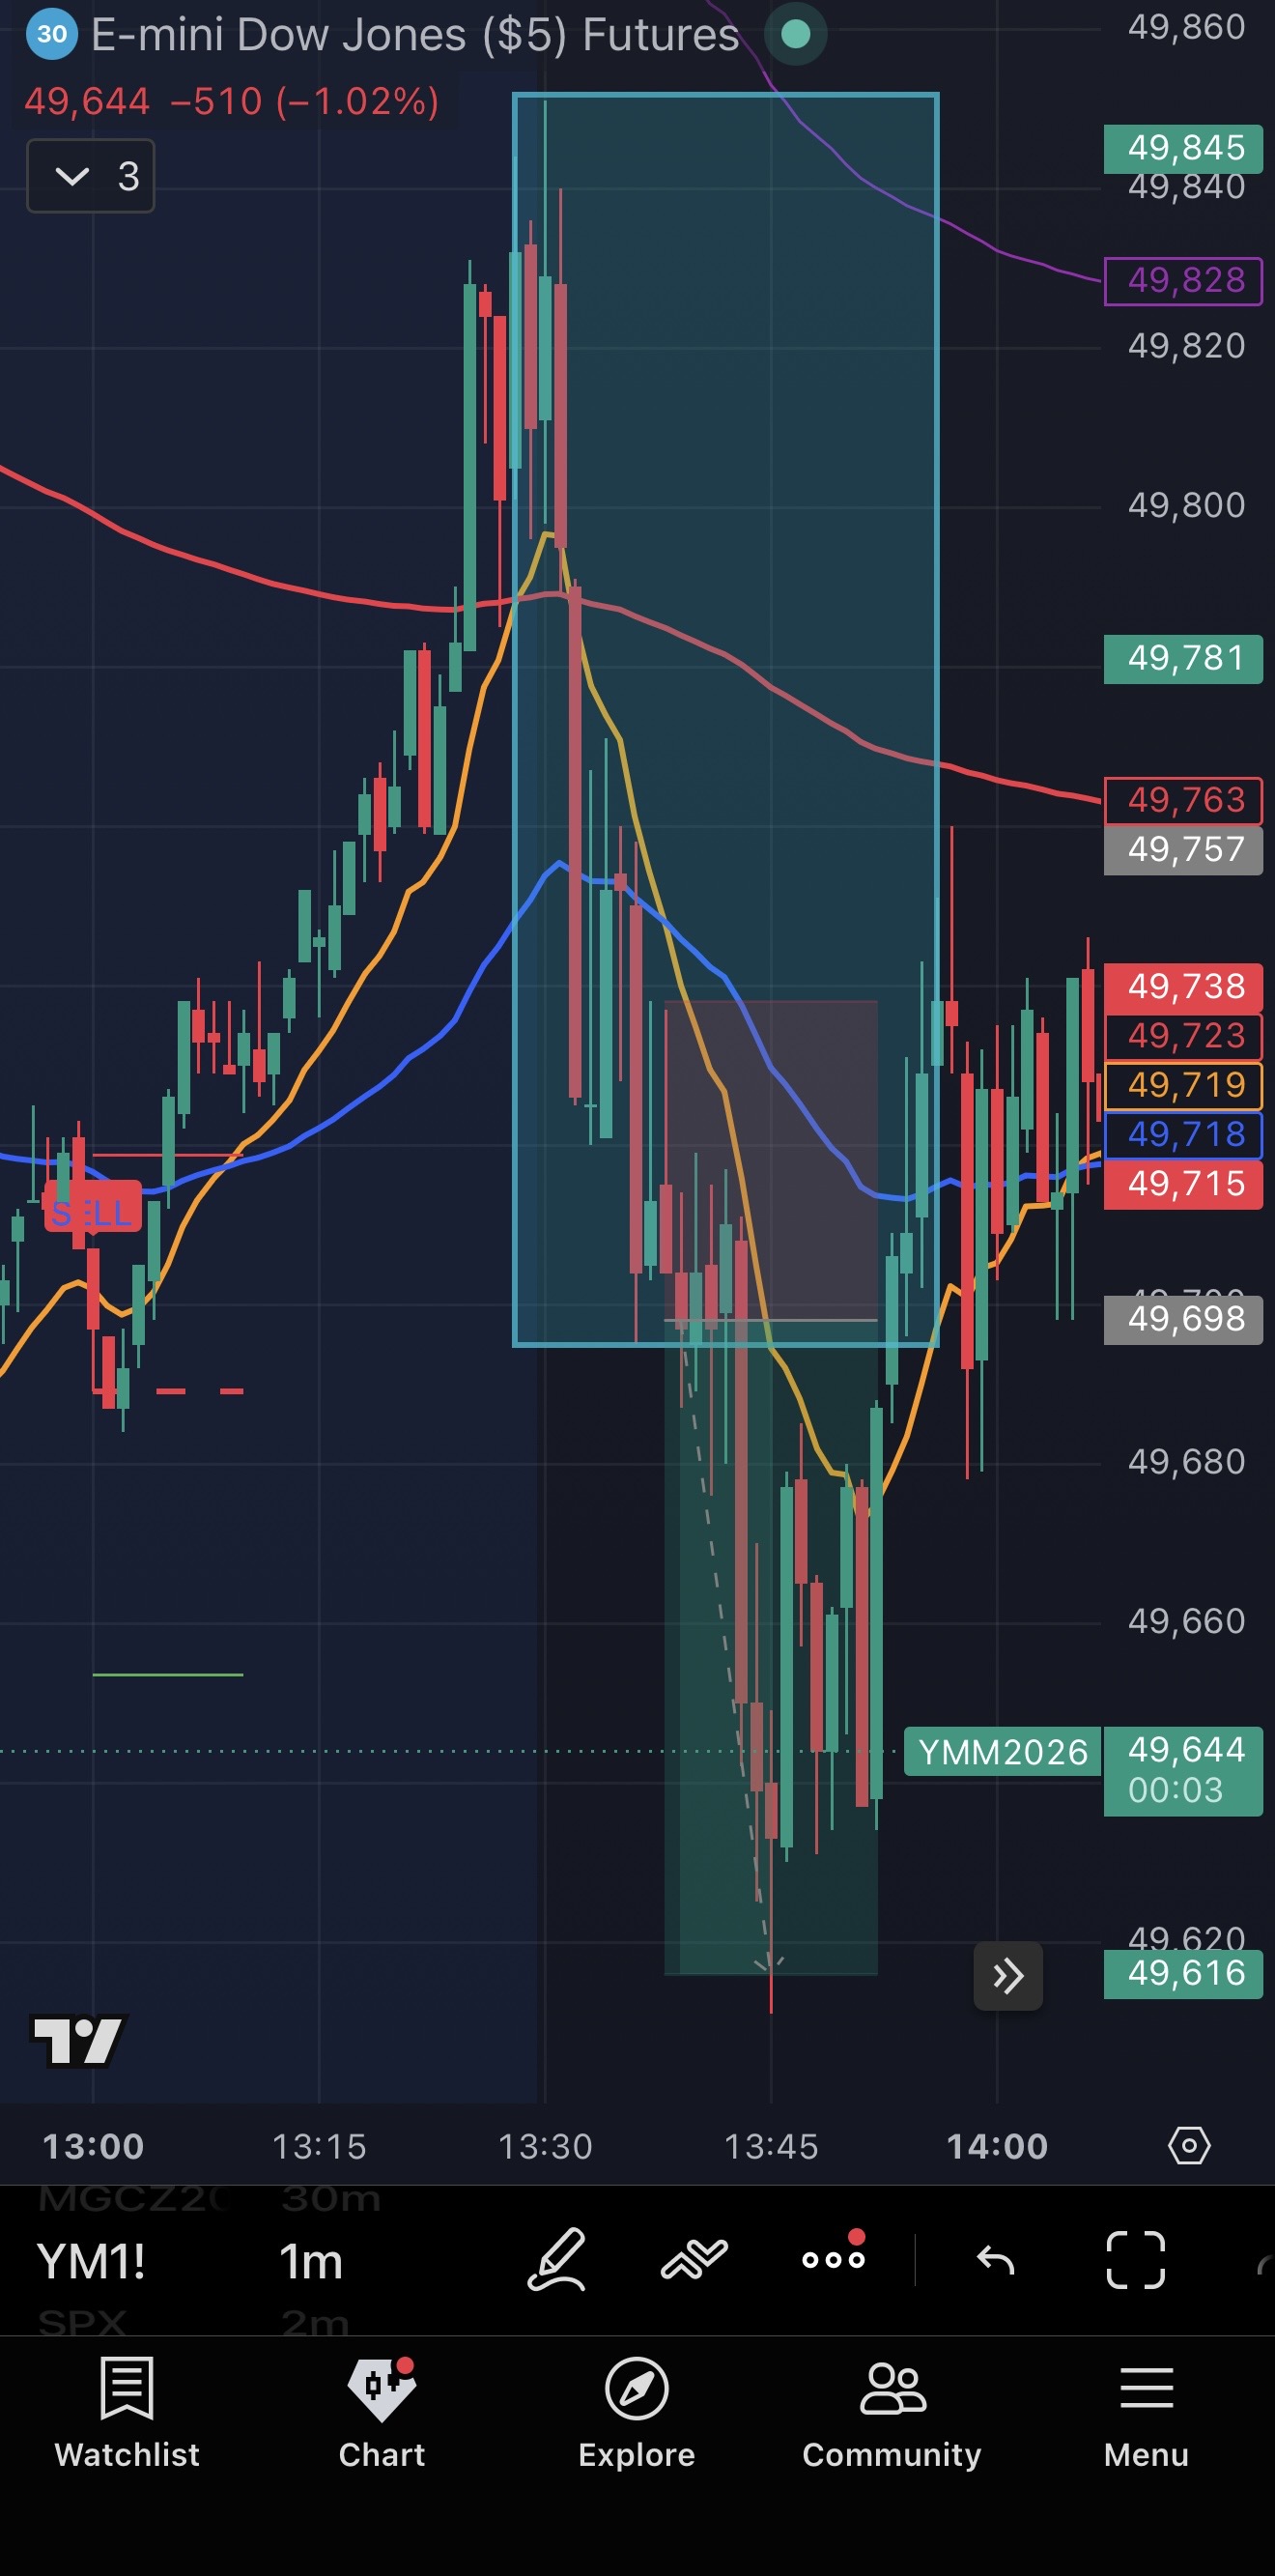
entry
49,697
stop
49,738
target
49,615
R:R
1:2.0
Another day, another 5 min ORD breakout trade.
Confirmed in HTF that we are on an overall downtrend, price moving below and away from EMAs. After the first 5 min of market open, price broke out of OR…
Be the first to grade
Sign in to grade
🔍 tap to enlarge
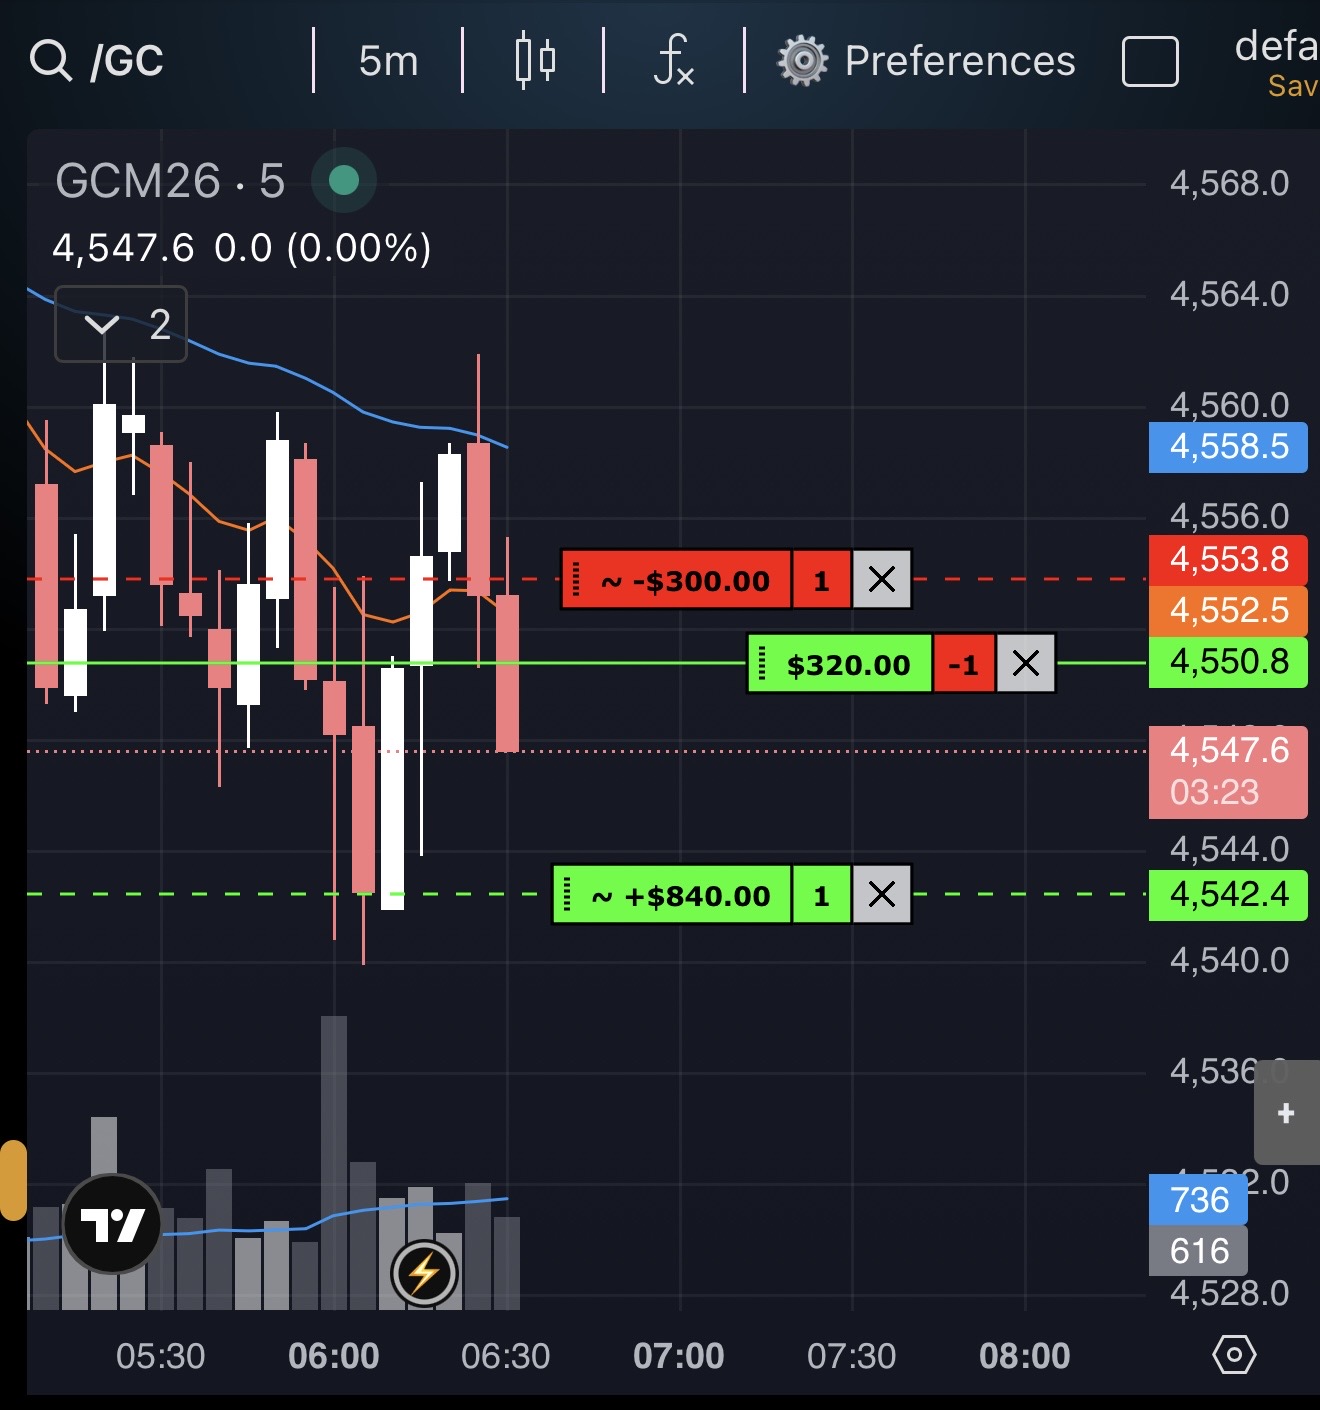
entry
4,550.8
stop
4,553.8
target
4,542.4
R:R
1:2.8
EMA stacked in my favor with a double top forming. 15m and 30m suggested market structure shift to the downside. Entered at BOC of previous candle that closed before Ema. Targeted previous swing lows …
Be the first to grade
Sign in to grade
🔍 tap to enlarge
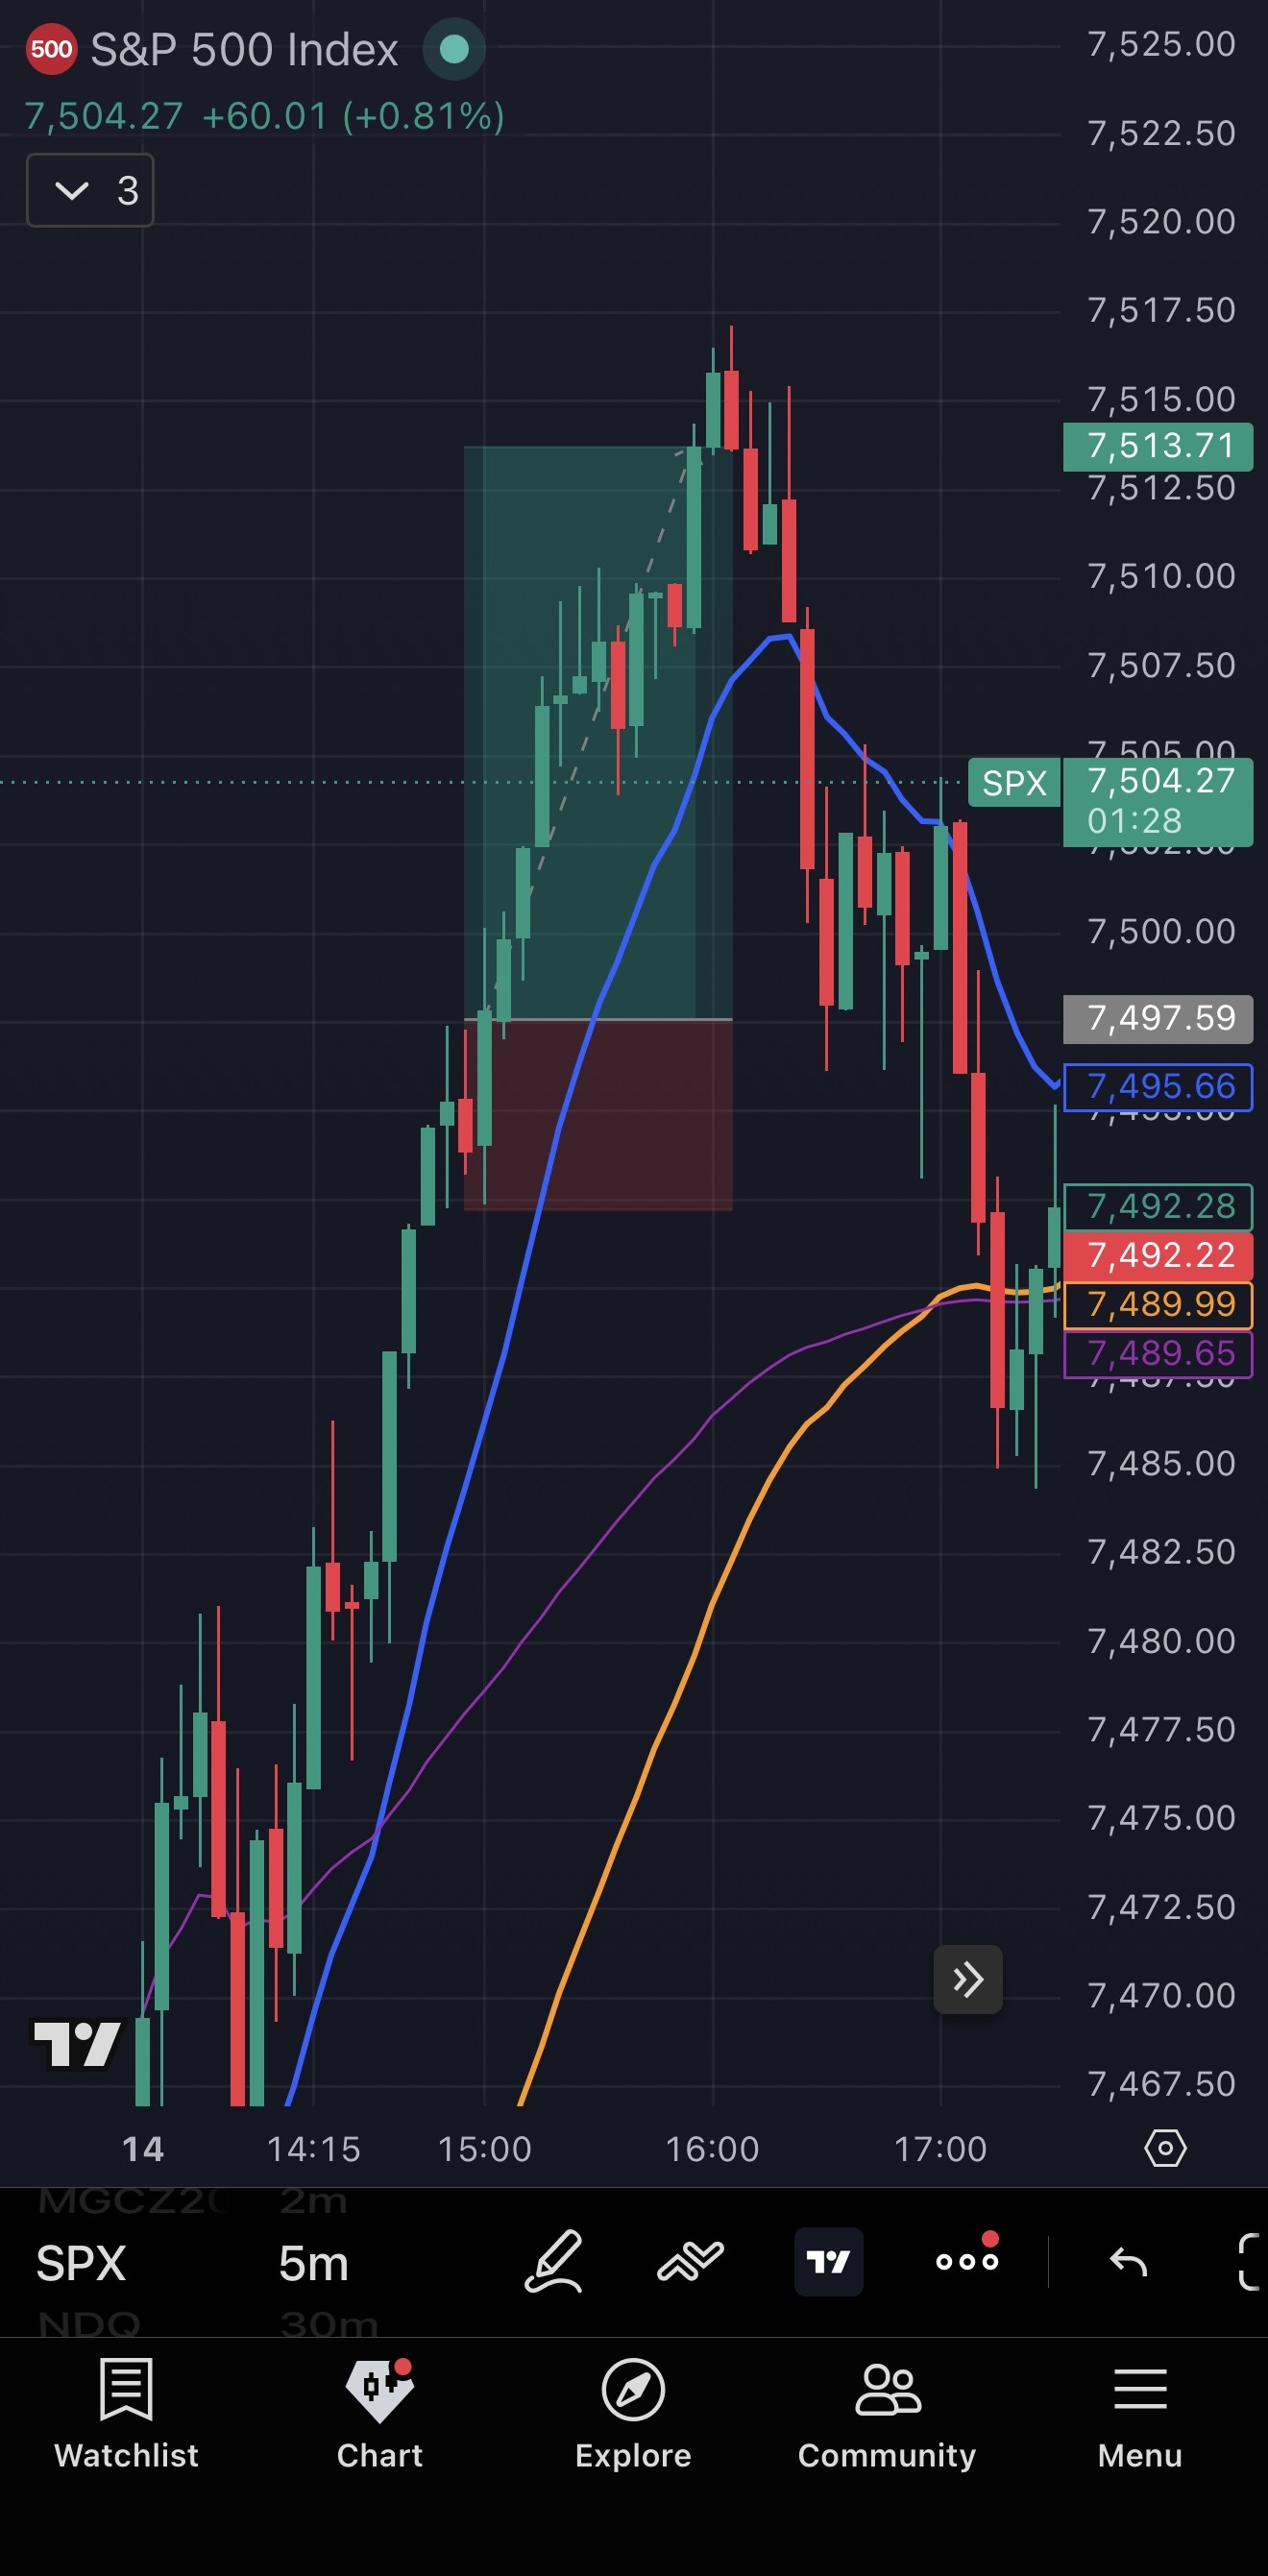
entry
7,497.52
stop
7,492.2
target
7,513.74
R:R
1:3.0
I’m back everyone! Wow chart grader improved quite a bit.
Took a quick scalp this morning. HTF confirmed that we are overall uptrend and moving away from all EMAs. Lower EMAs were also aligned. A goo…
Be the first to grade
Sign in to grade
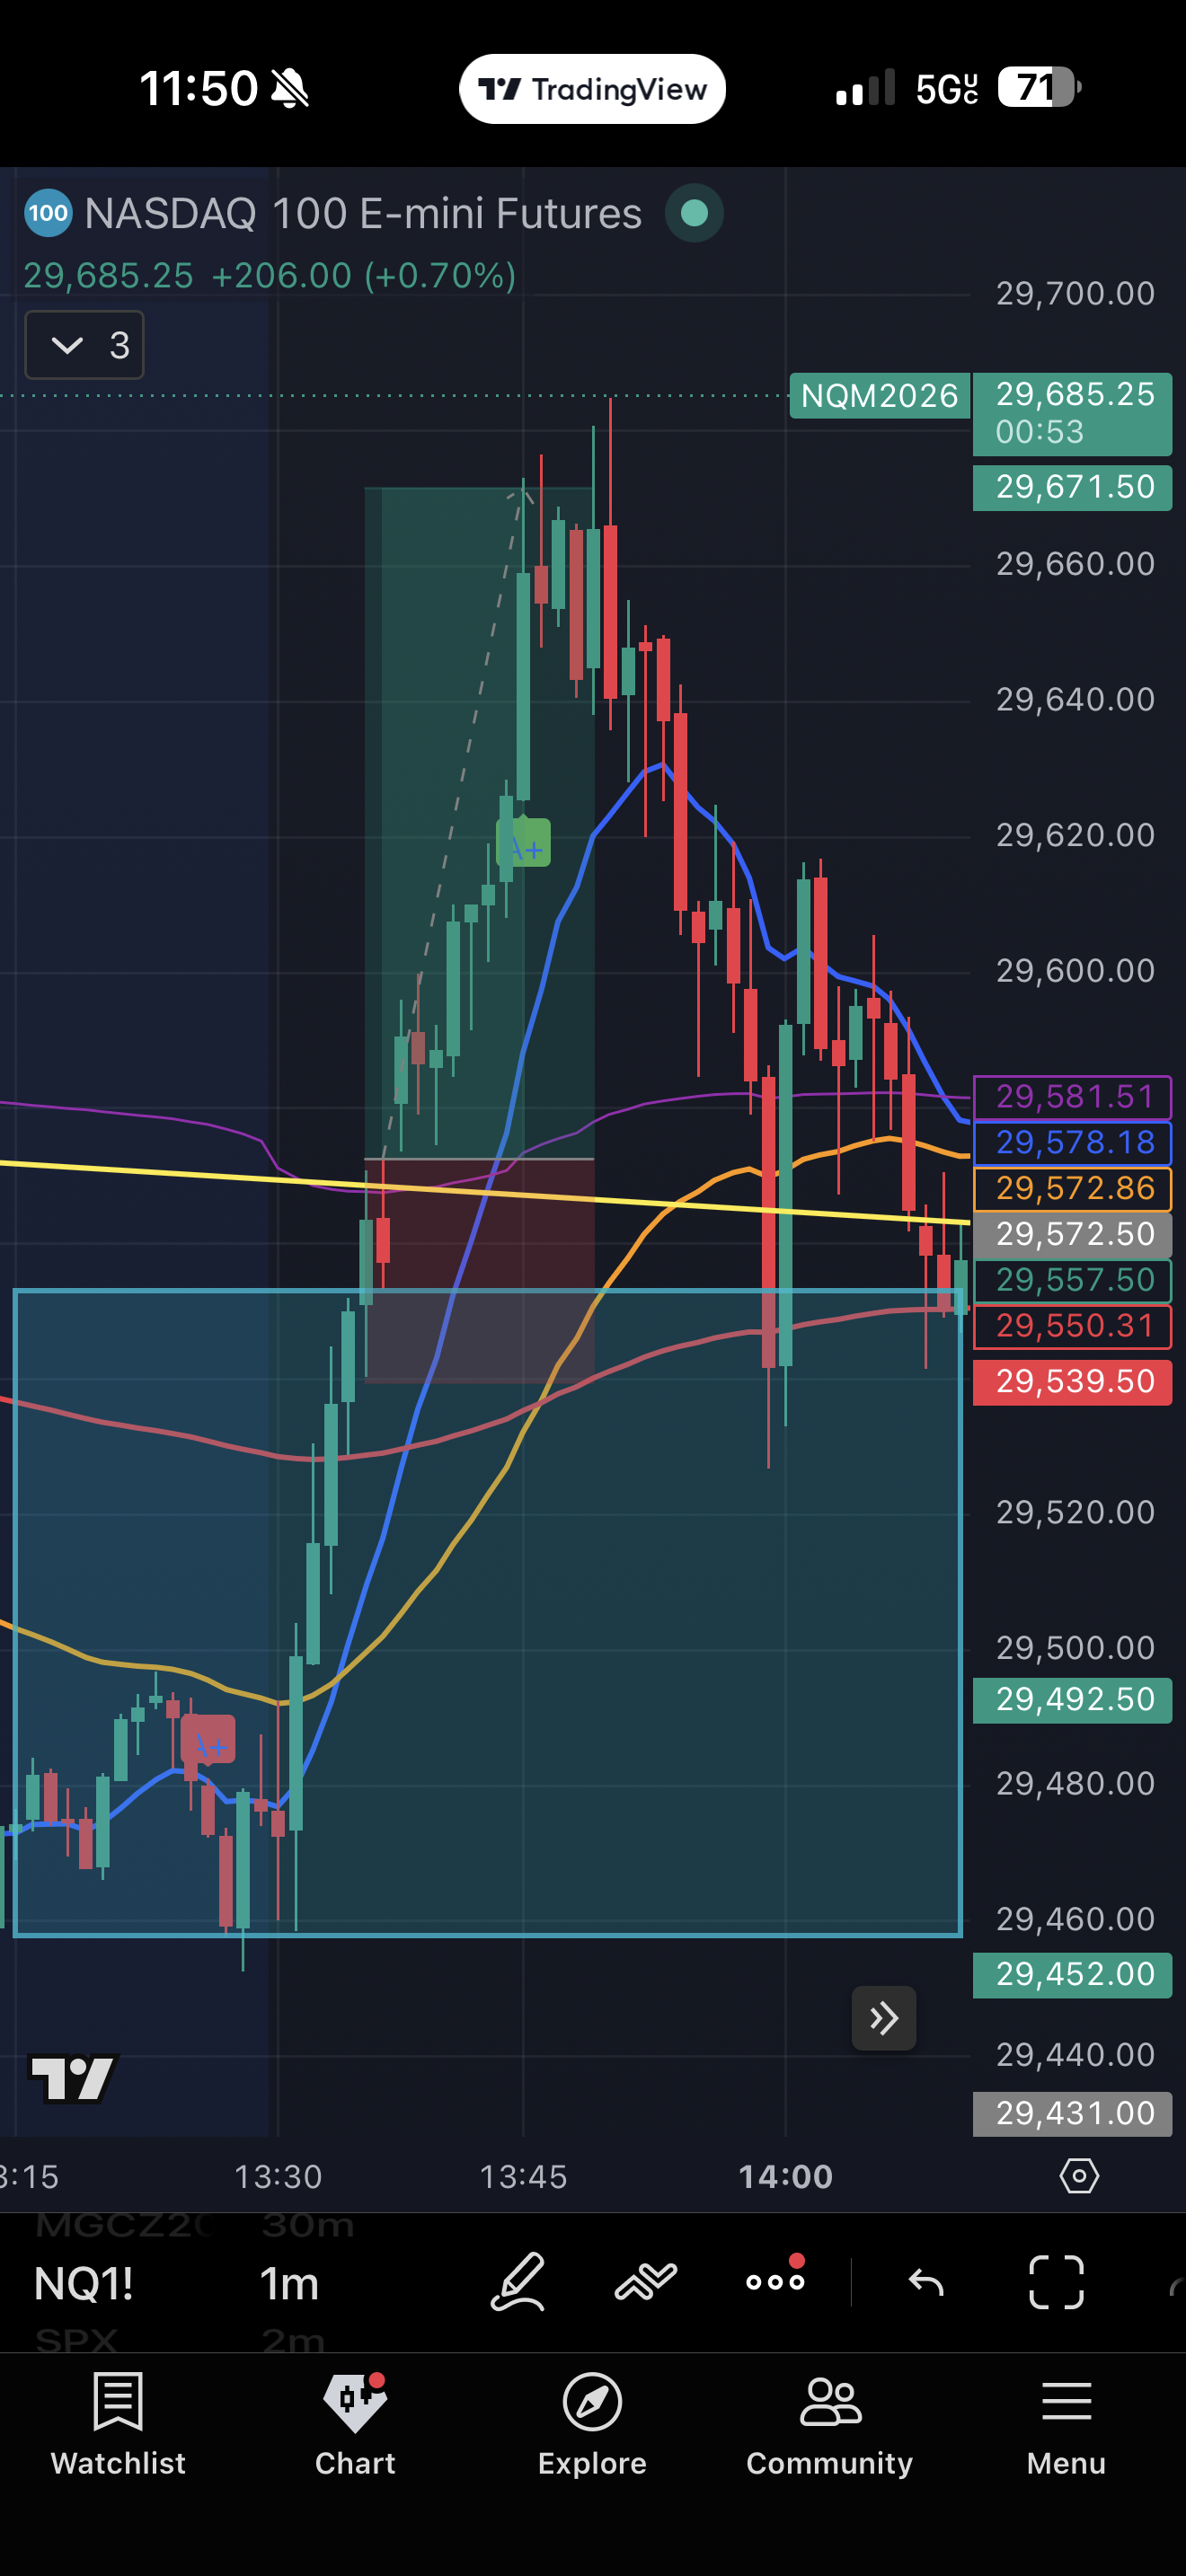
🔍 tap to enlarge
entry
29,572.25
stop
29,539
target
29,671.25
R:R
1:3.0
5 min ORB breakout.
HTF confirmed candles are moving away from EMAs and that we are on a uptrend, creating higher highs at ATH. HTF also indicate an trendline break so that’s triple confirmation.
I …
A+11 reviews · 100% A+
Sign in to grade
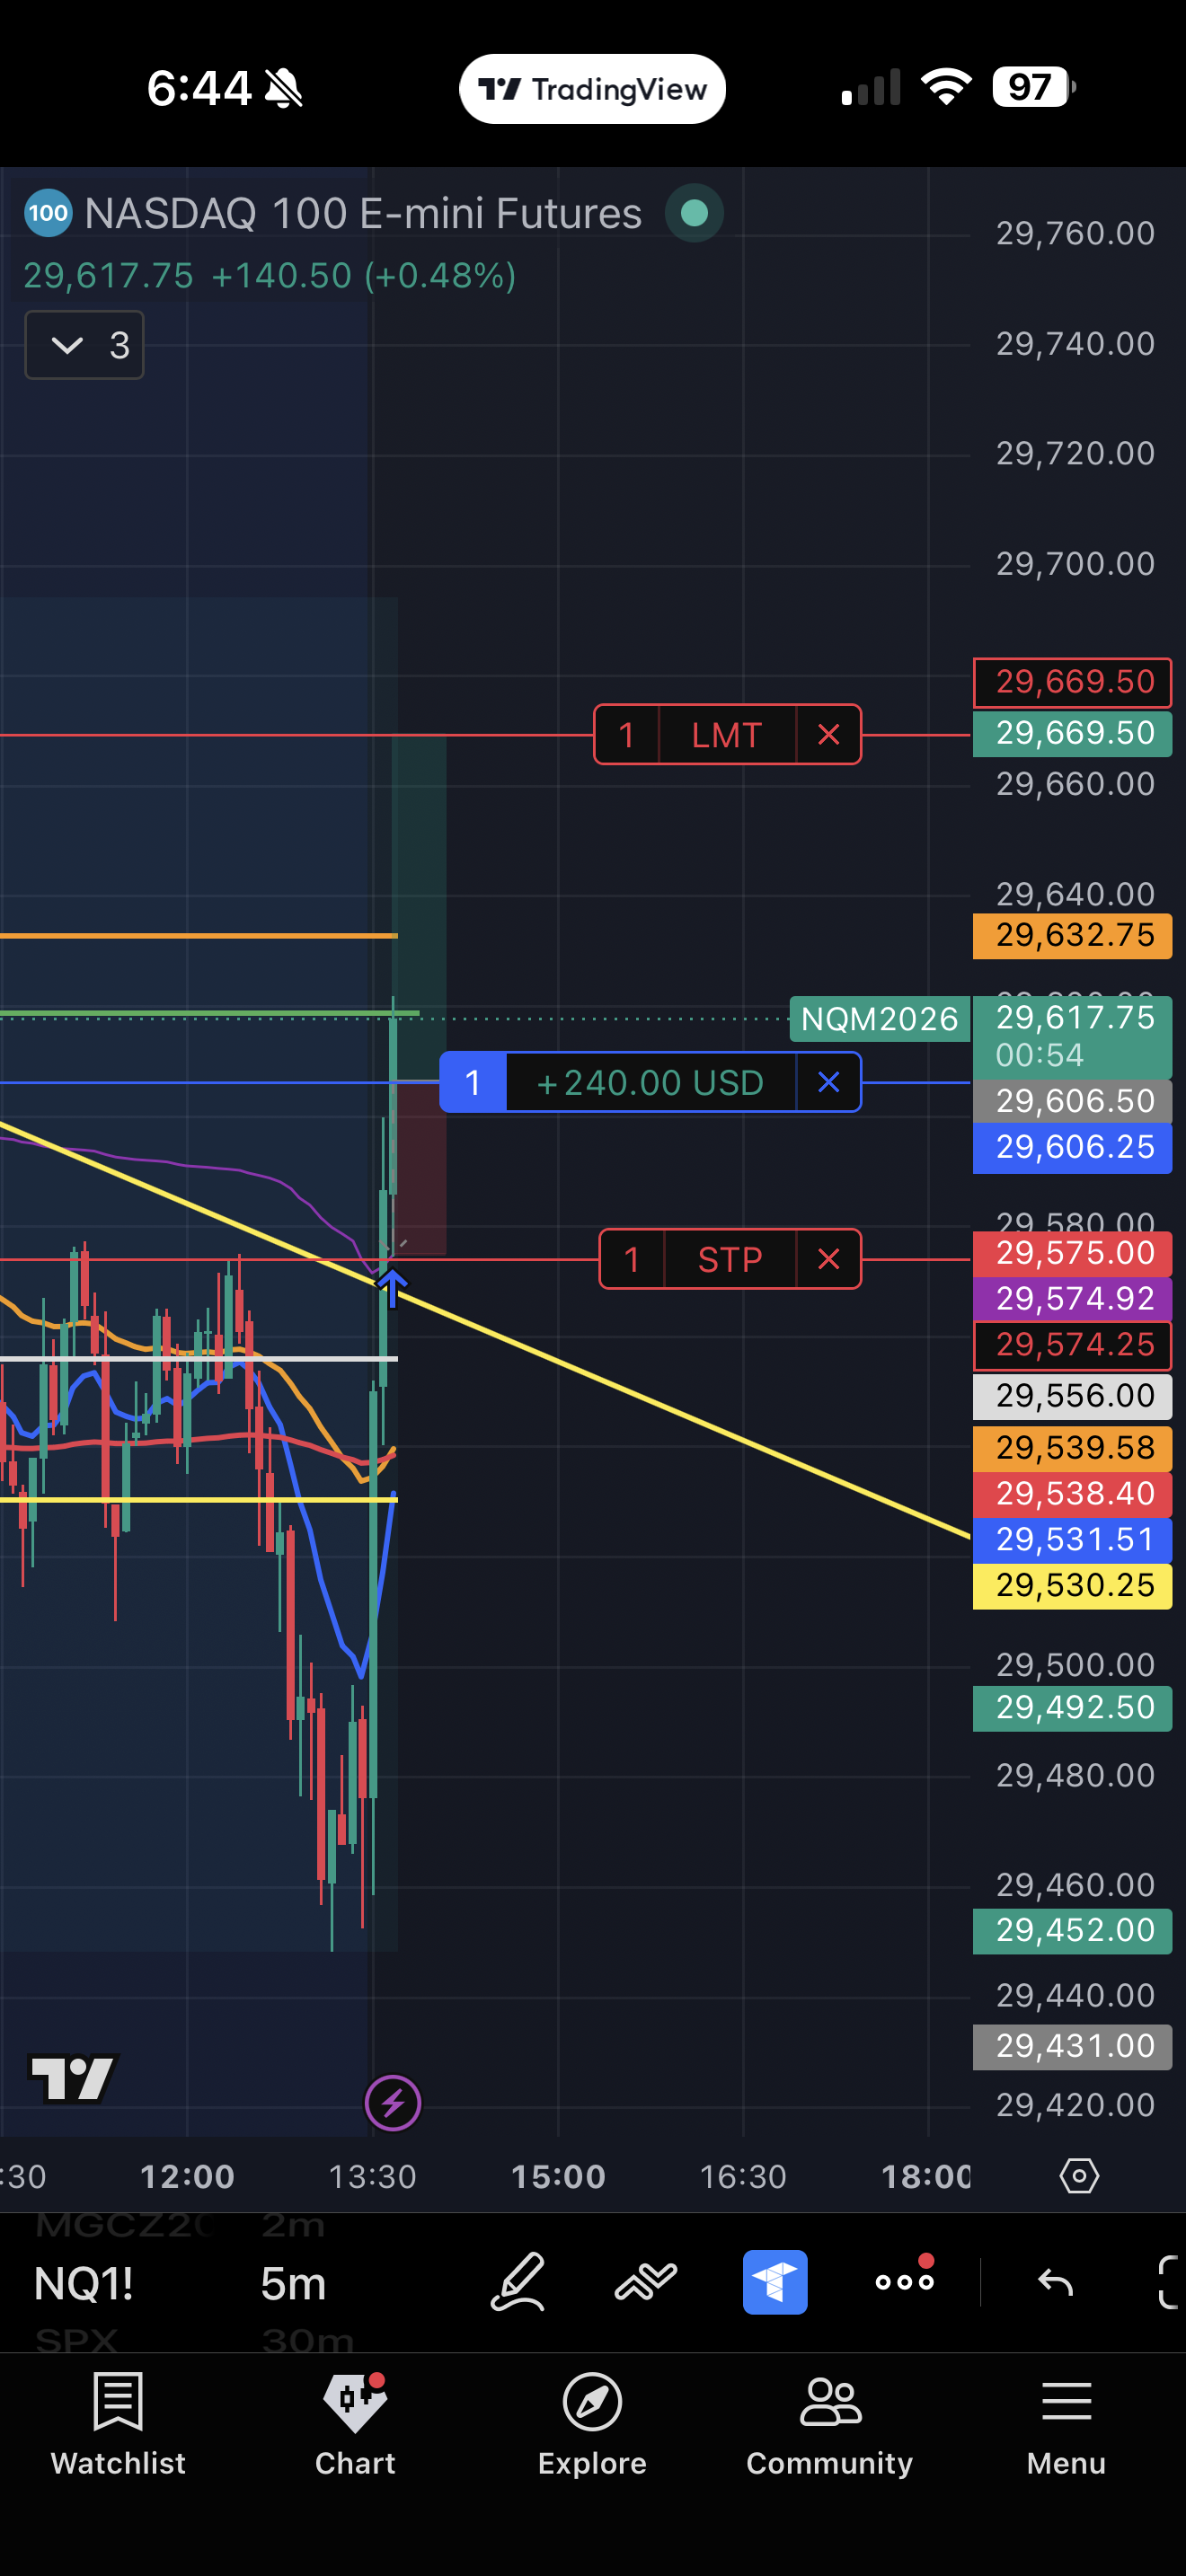
🔍 tap to enlarge
entry
29,606
stop
29,575
target
29,669.5
R:R
1:2.0
Checked premarket and the higher timeframe showed a trendline break in structure. I waited for the next candle to pull back for a retest and break the breakout candle before entering. Stop loss was pl…
A+11 reviews · 100% A+
Sign in to grade
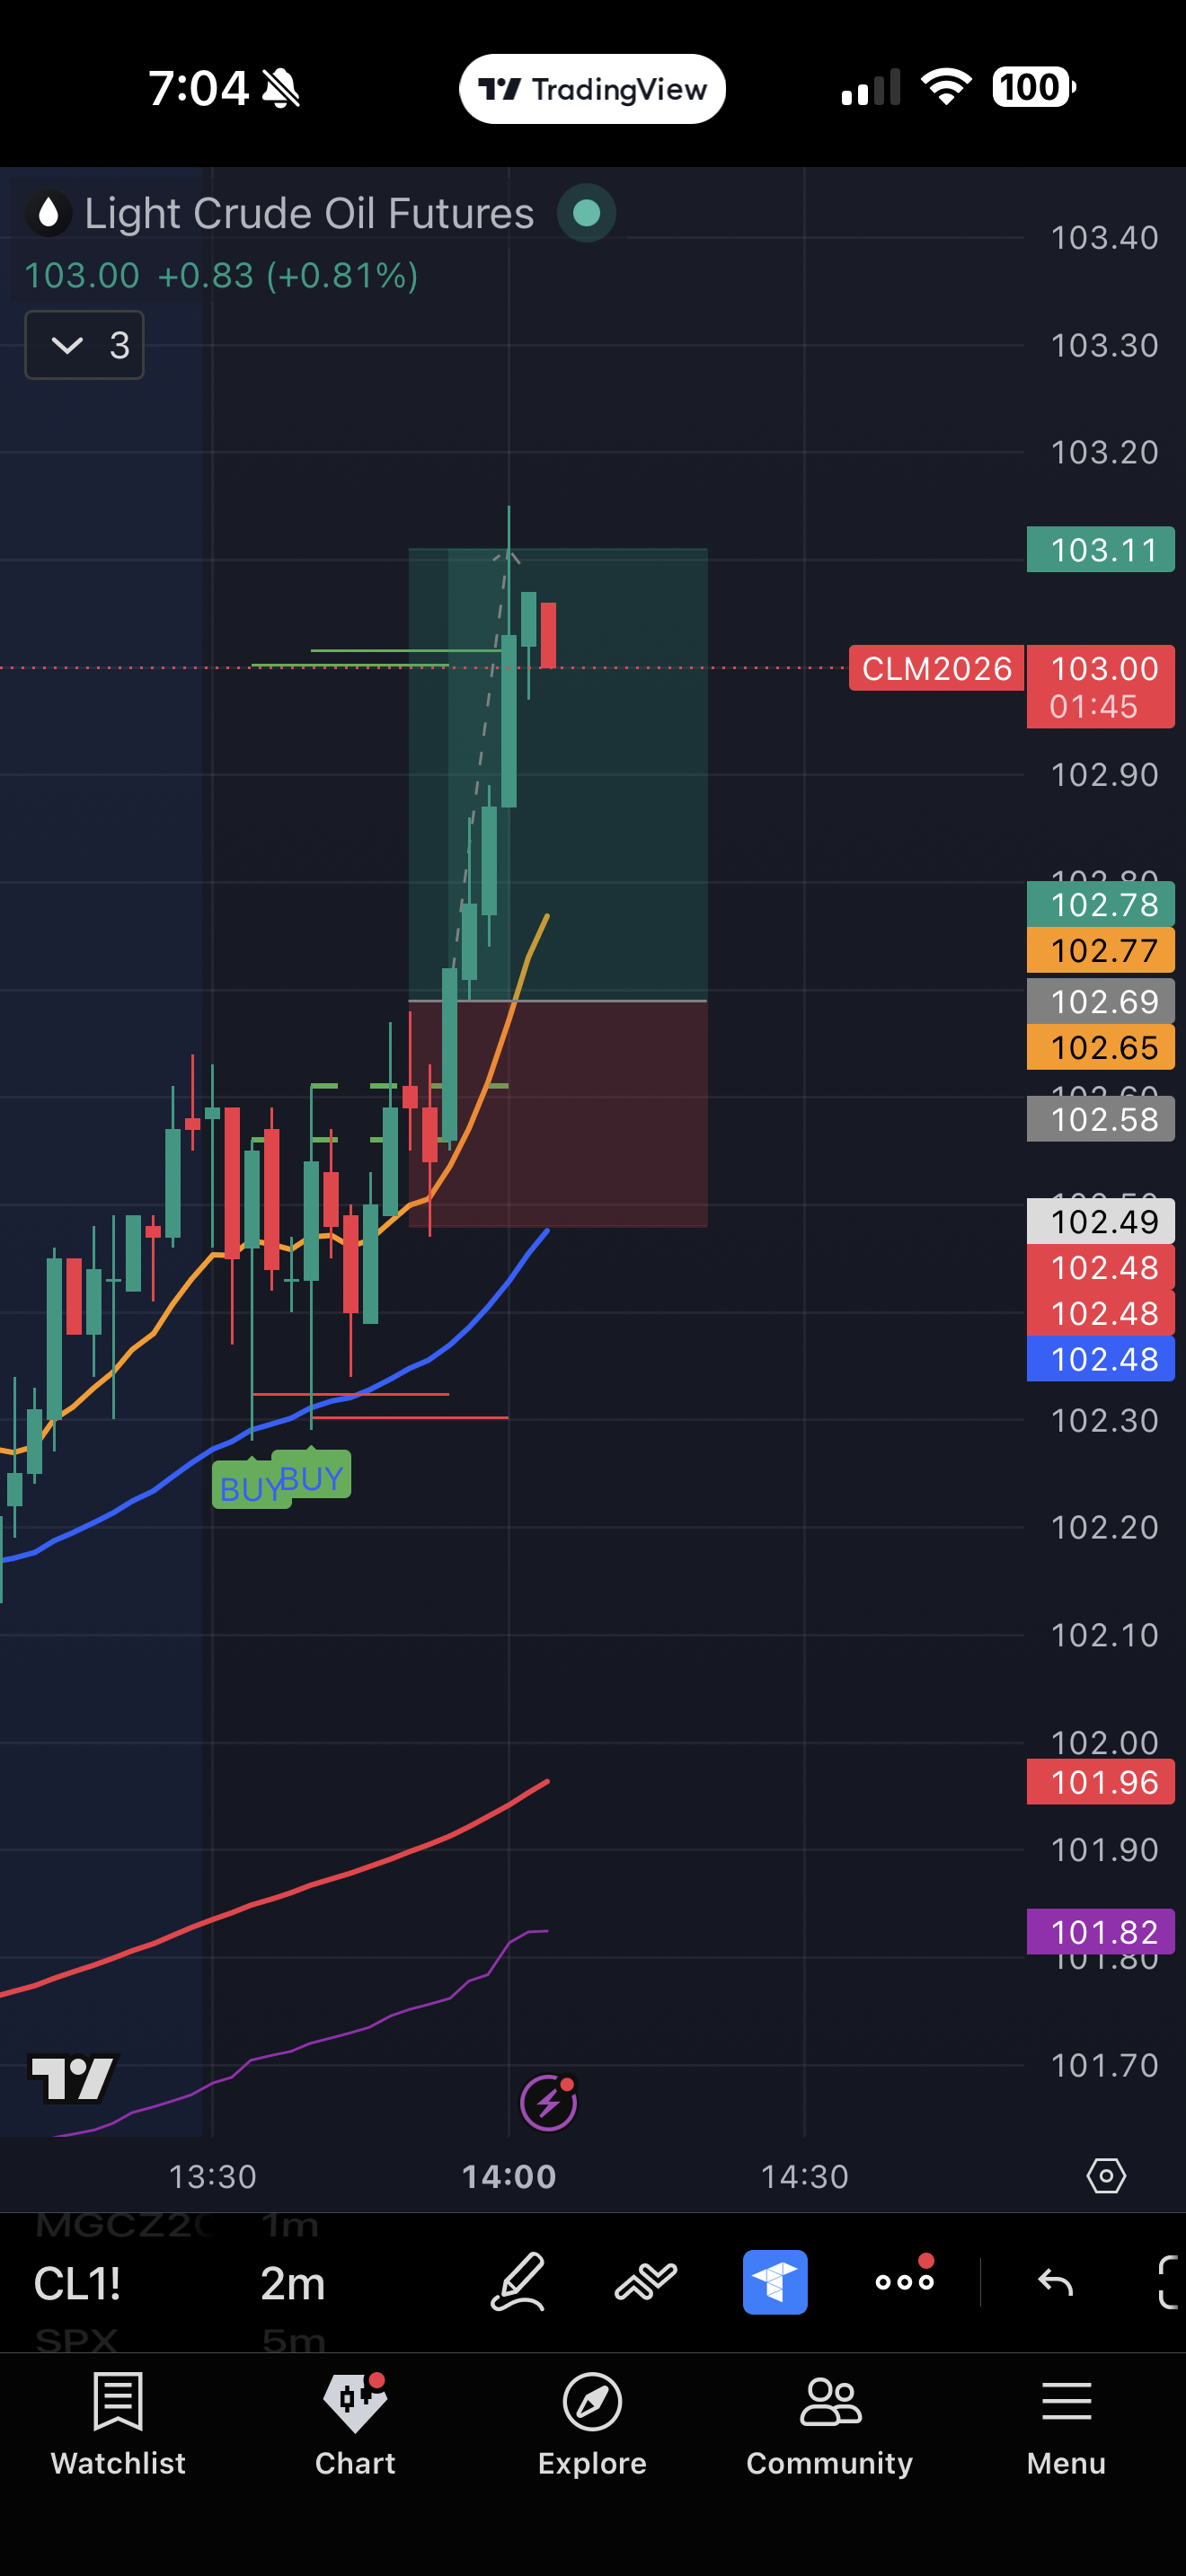
🔍 tap to enlarge
entry
102.69
stop
102.49
target
103.1
R:R
1:2.0
Breaking trade here
1. Confirmed in HTF that we were moving away from EMAs.
2. Lower timeframe confirmed EMA alignment. Candle rejected off of EMA 13 and broke out.
The next candle retested and move…
Be the first to grade
Sign in to grade
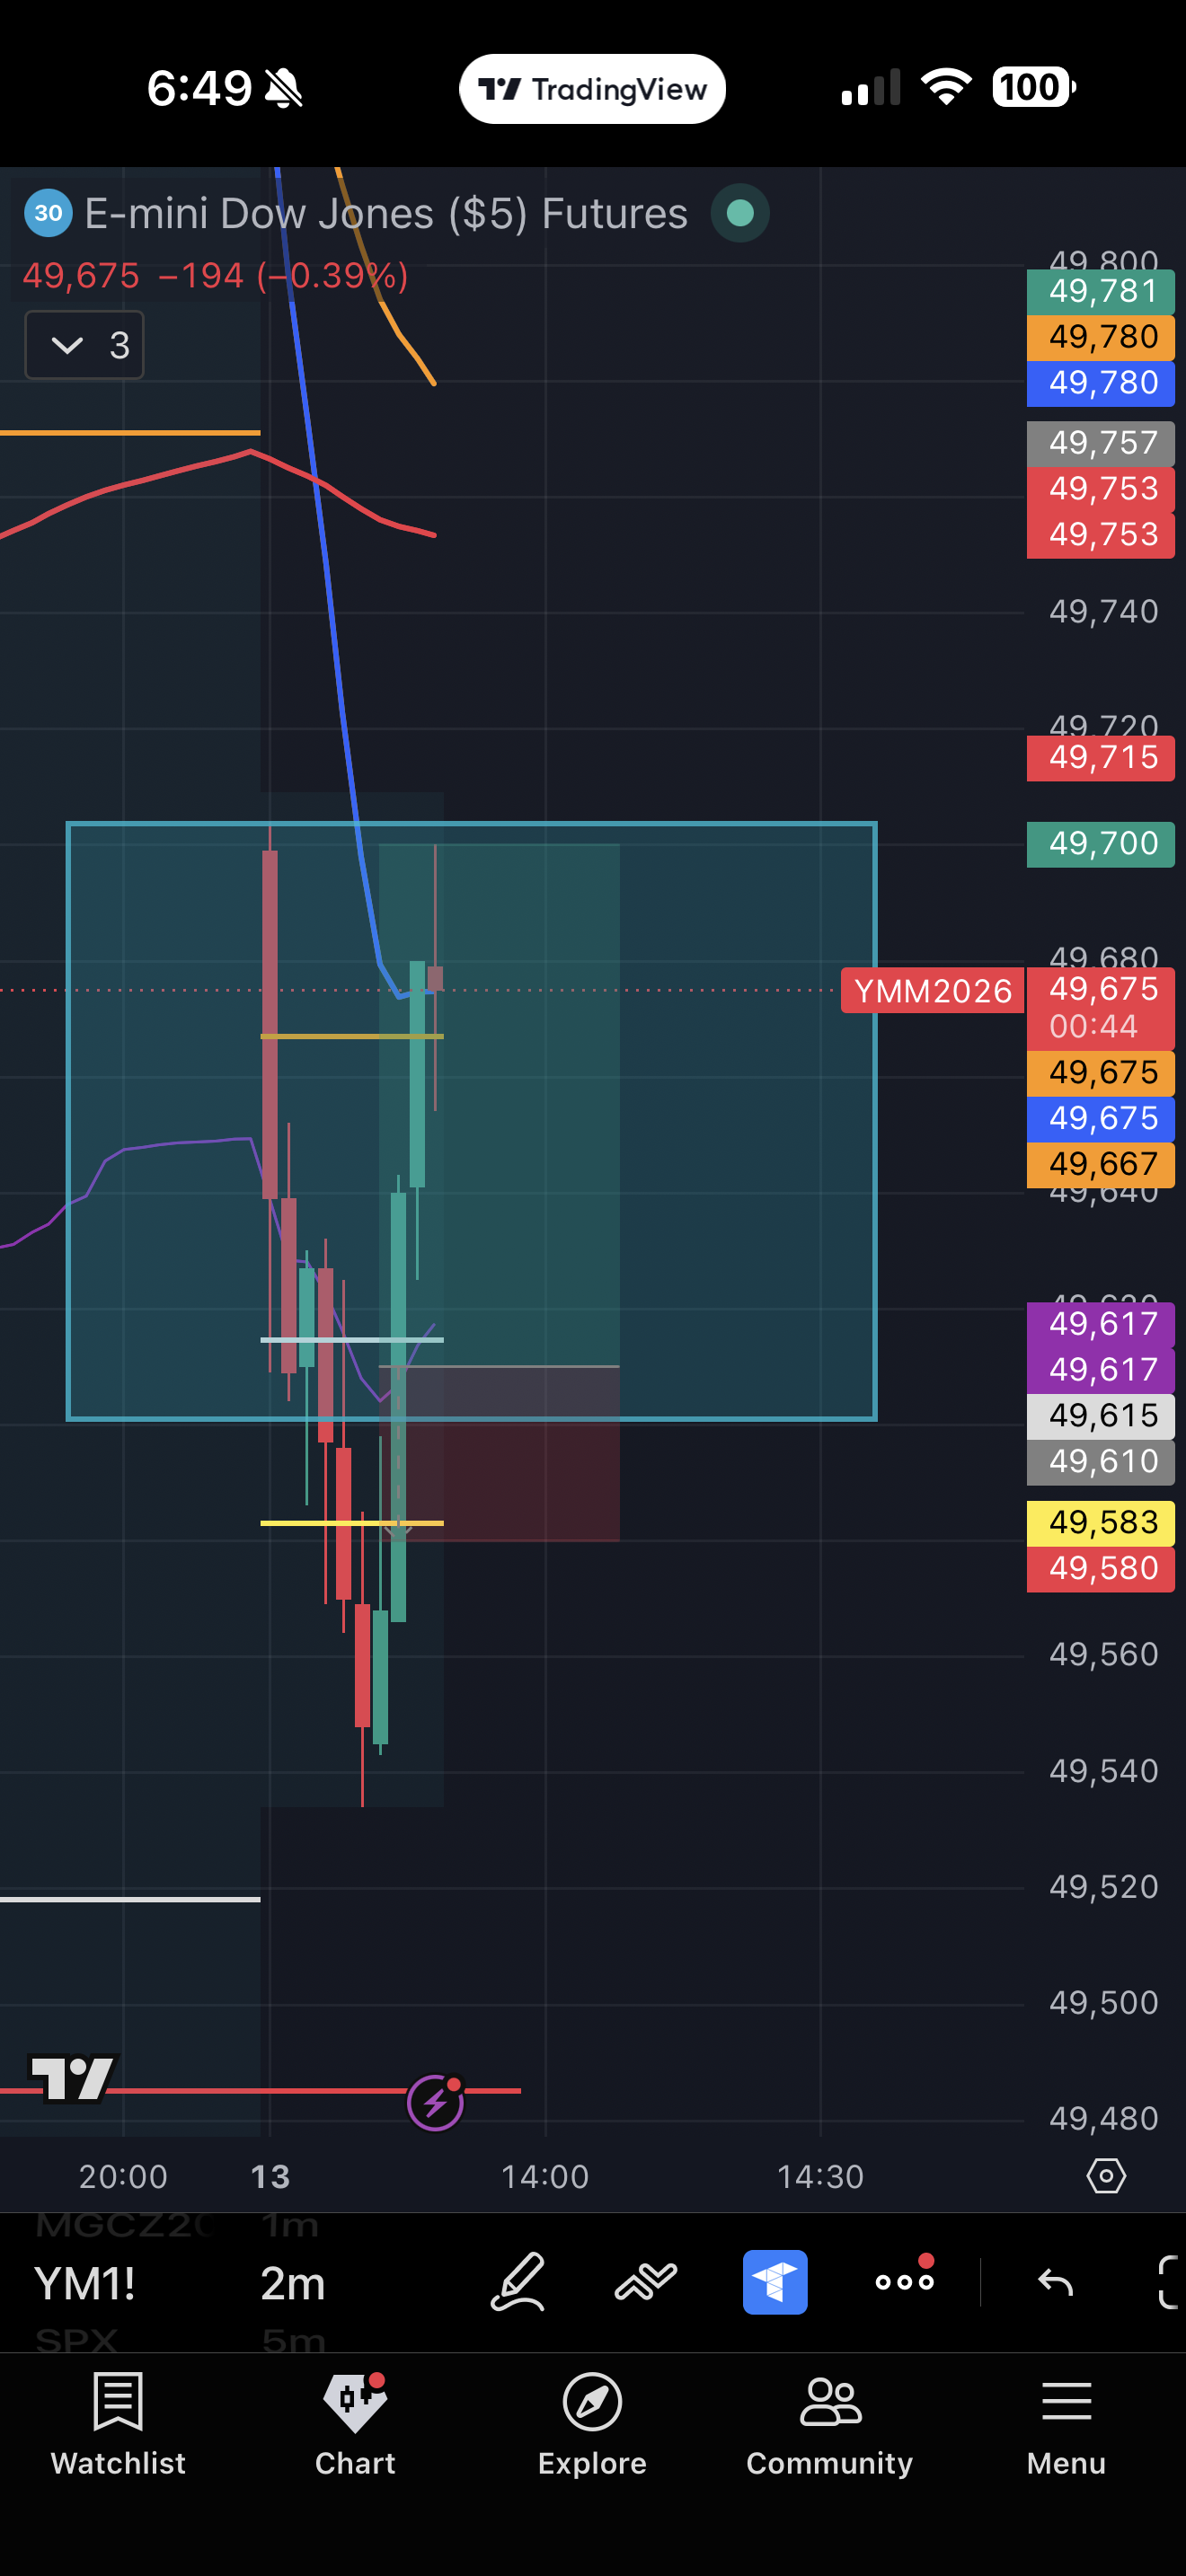
🔍 tap to enlarge
entry
49,617
stop
49,580
target
49,691
R:R
1:2.0
5 minute ORB failed to break out and reversed back into zone. Confirmed at HTF that it’s moving away from the EMAs. Saw resistance to go down at 49514 range. Entered at the break of the reversal candl…
Be the first to grade
Sign in to grade
🔍 tap to enlarge
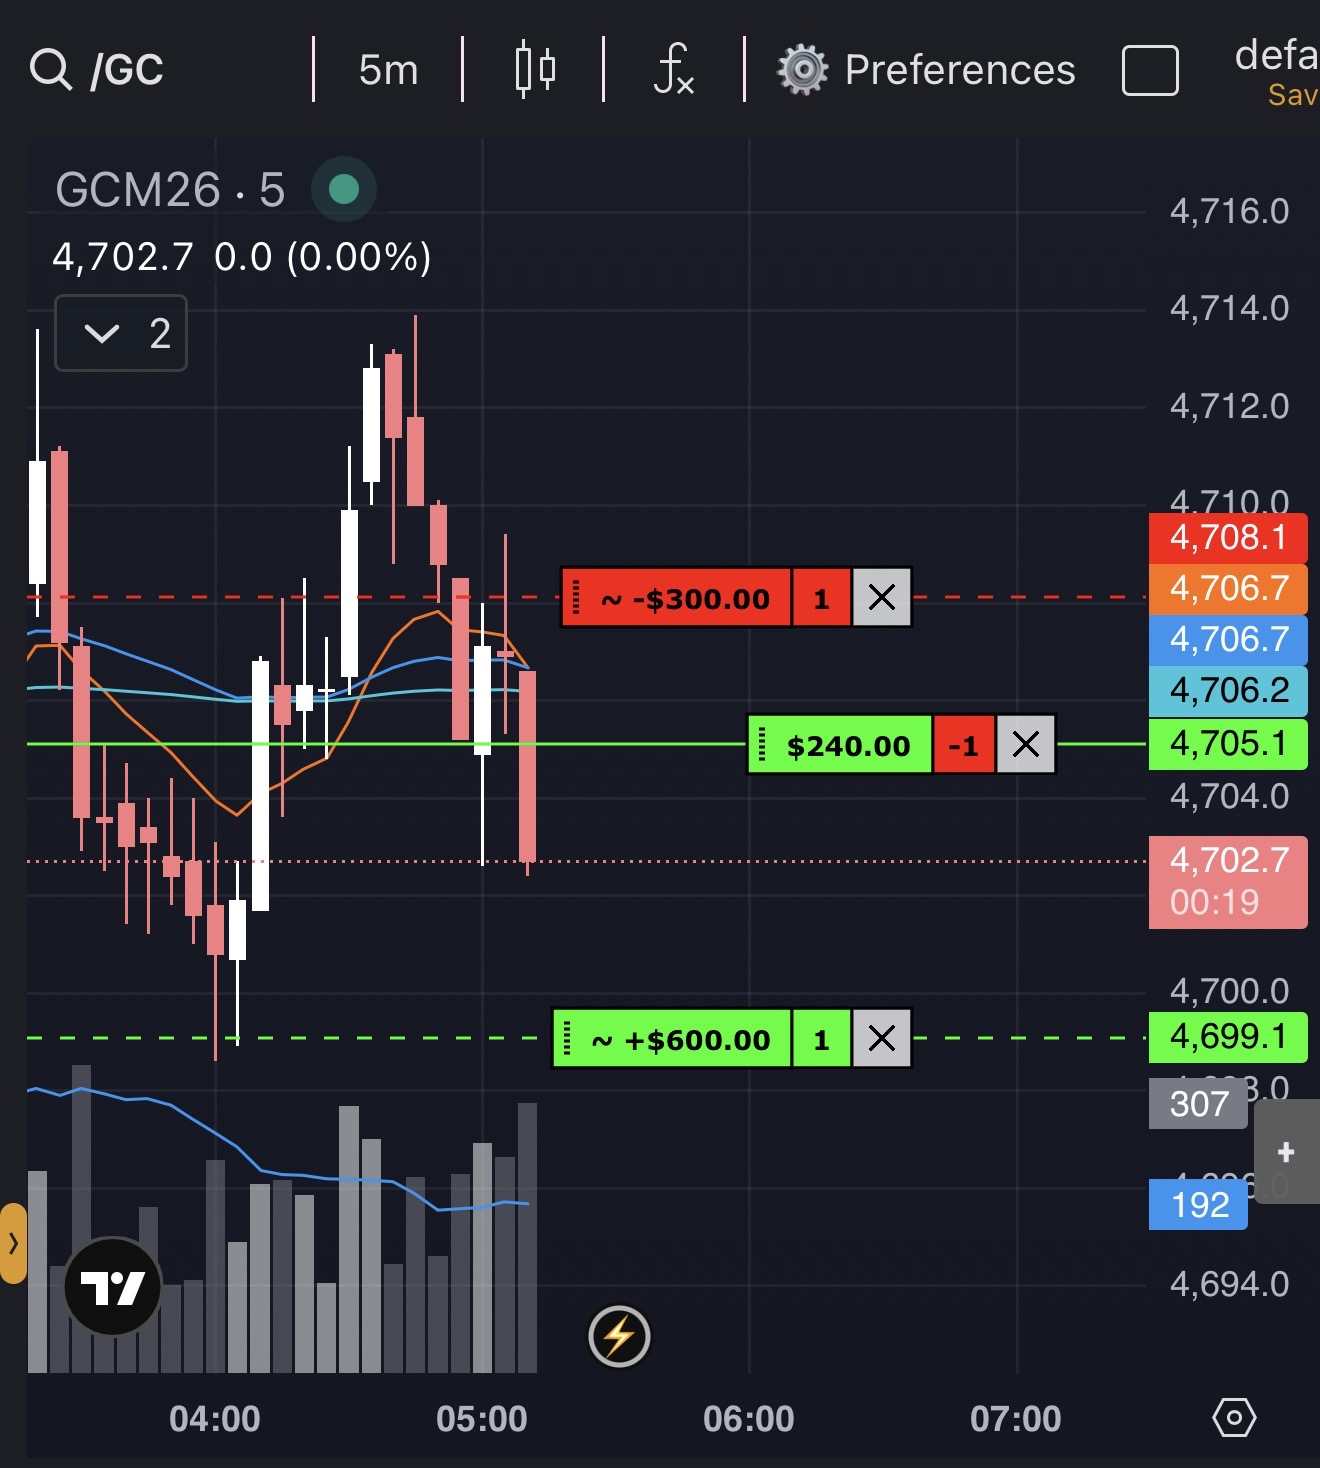
entry
4,705.1
stop
4,708.1
target
4,699.1
R:R
1:2.0
Double top liquidity sweep on the 5 min combined with EMA deathcross. Take profit set at previous swing lows. Stop loss set to how much I’m willing to risk per trade. 1hour timeframe was on a downtren…
Be the first to grade
Sign in to grade
🔍 tap to enlarge
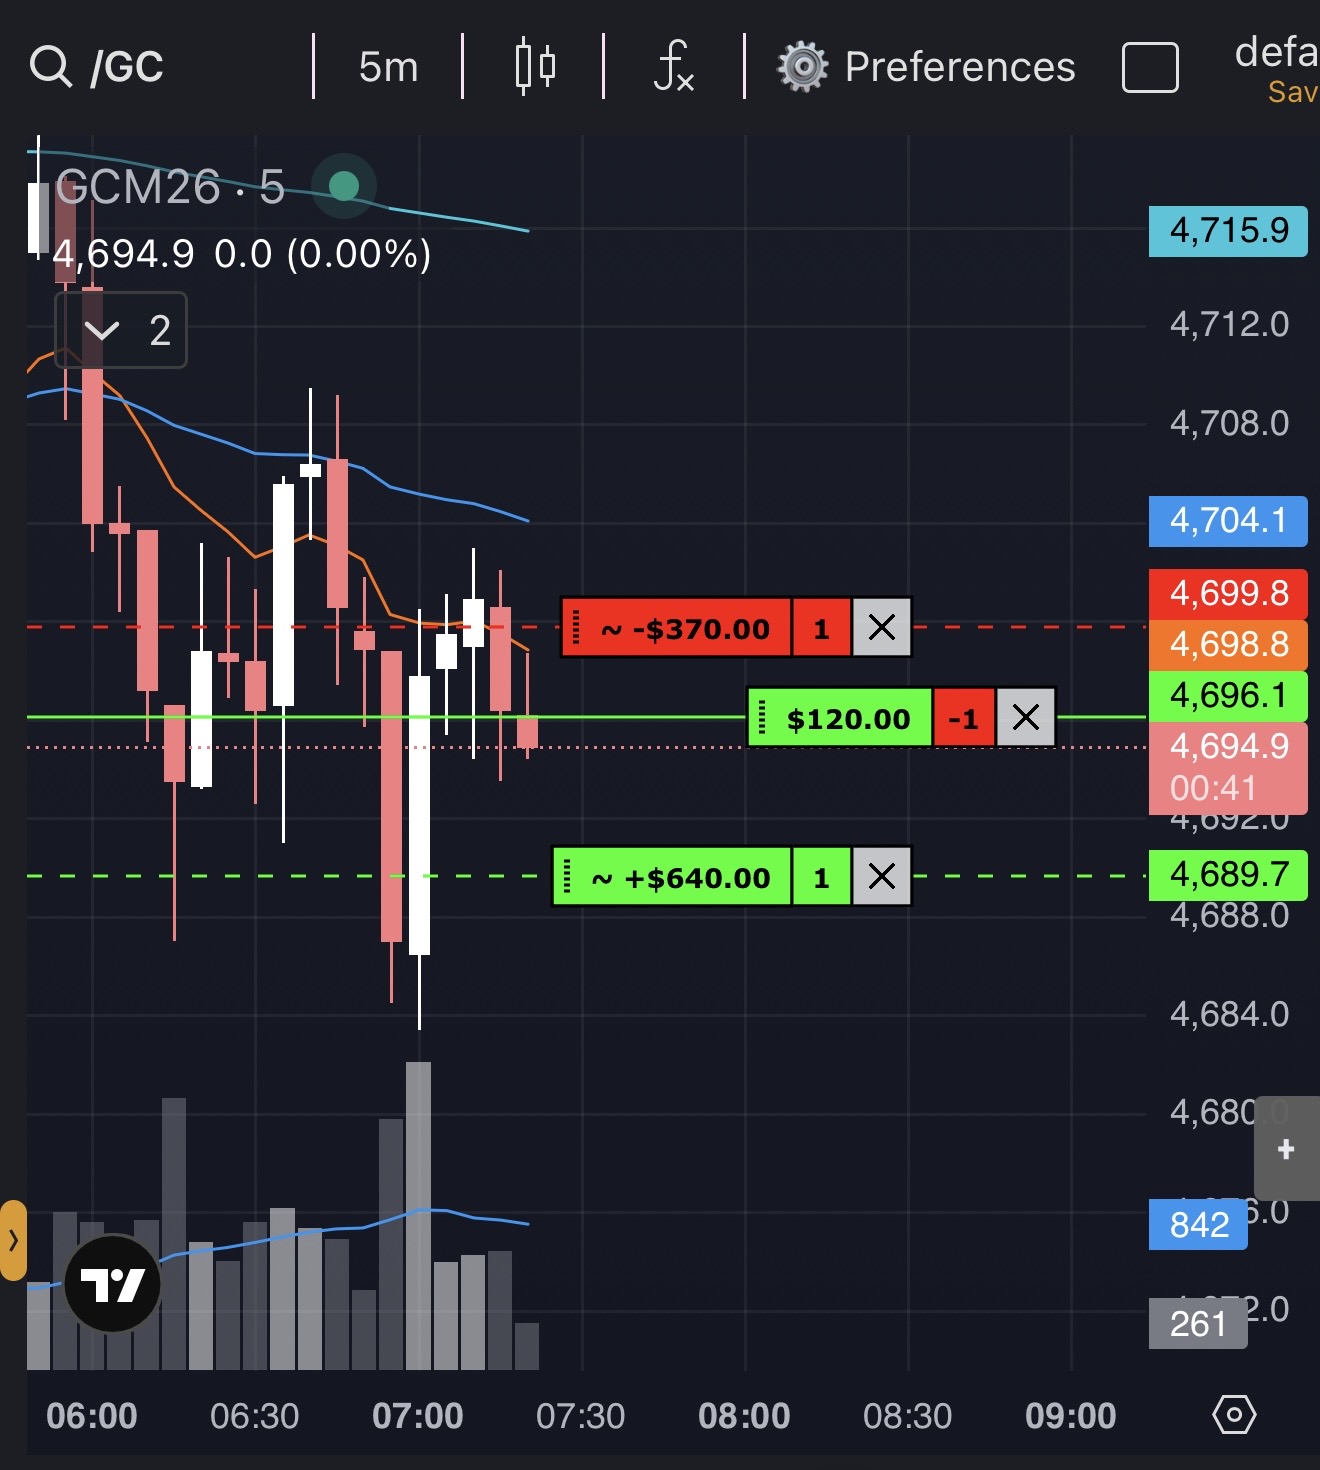
entry
4,696.1
stop
4,699.8
target
4,689.7
R:R
1:1.7
15 min downtrend went to 5m also downtrend. Tapped into a supply zone. EMAs were stacked for a short. Stop loss placed above EMA. Only needed to make 600 so placed a take for 640 for commissions.
Be the first to grade
Sign in to grade

🔍 tap to enlarge
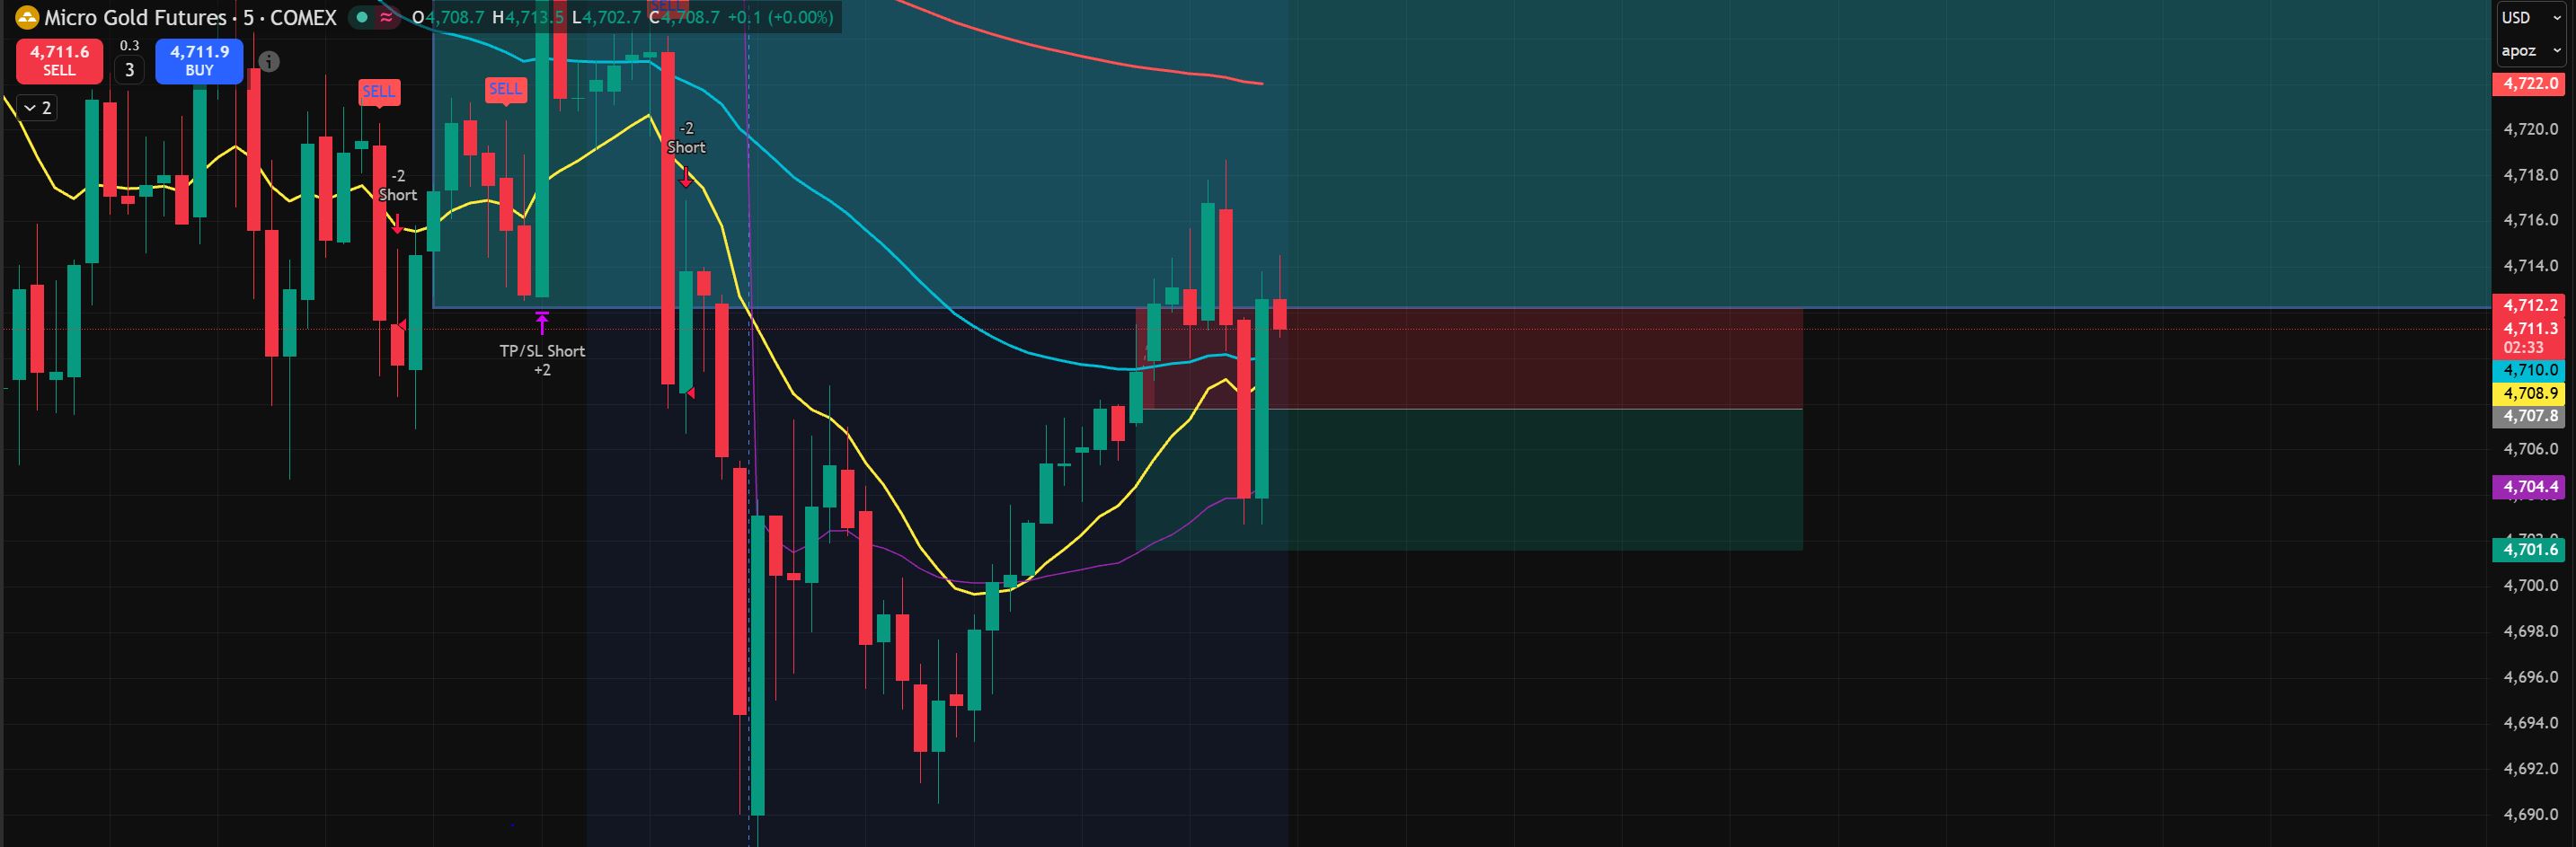
entry
4,708
stop
4,712.2
target
4,701.6
R:R
1:1.5
EMAs were lined up clean for a short setup, and price pushed into a supply zone. I waited for confirmation with a candle break and saw strong momentum cut through the 50 and 13 EMA, so I entered short…
Be the first to grade
Sign in to grade
🔍 tap to enlarge
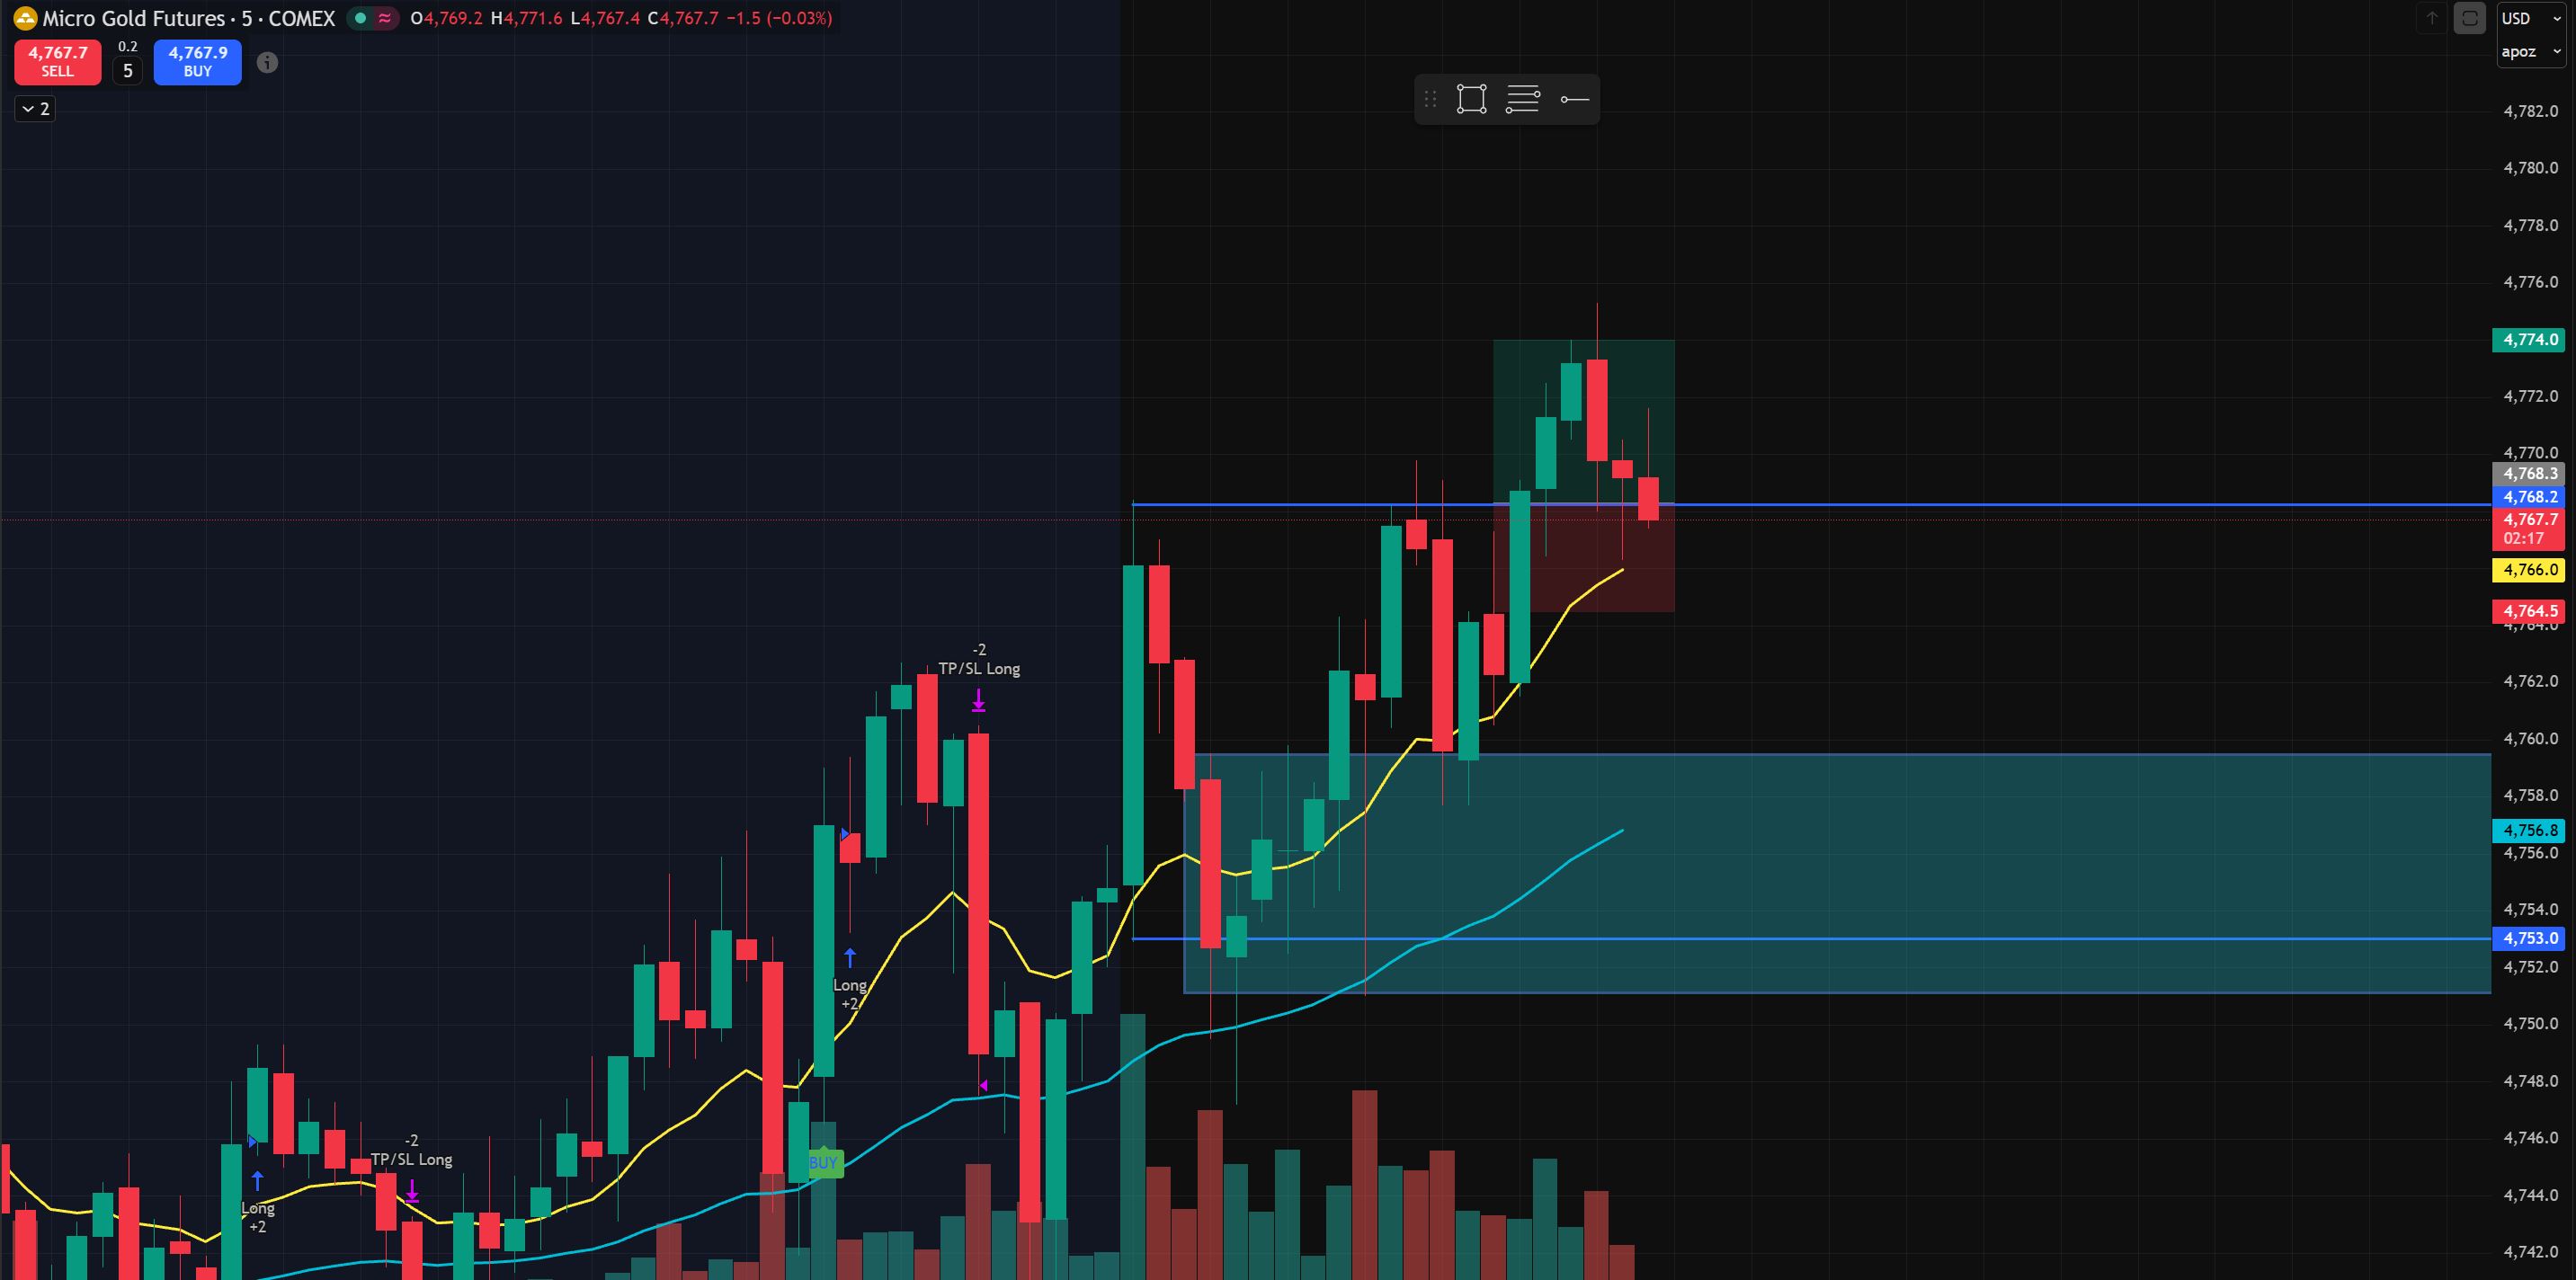
entry
4,768.1
stop
4,764.2
target
4,774
R:R
1:1.5
Quick scalp. EMAs were aligned bullish across all timeframes. Price tapped into a 5M demand zone and bounced off the 13 EMA for first confluence. Then price broke and retested today’s highs for additi…
B11 reviews · 100% B
Sign in to grade
🔍 tap to enlarge
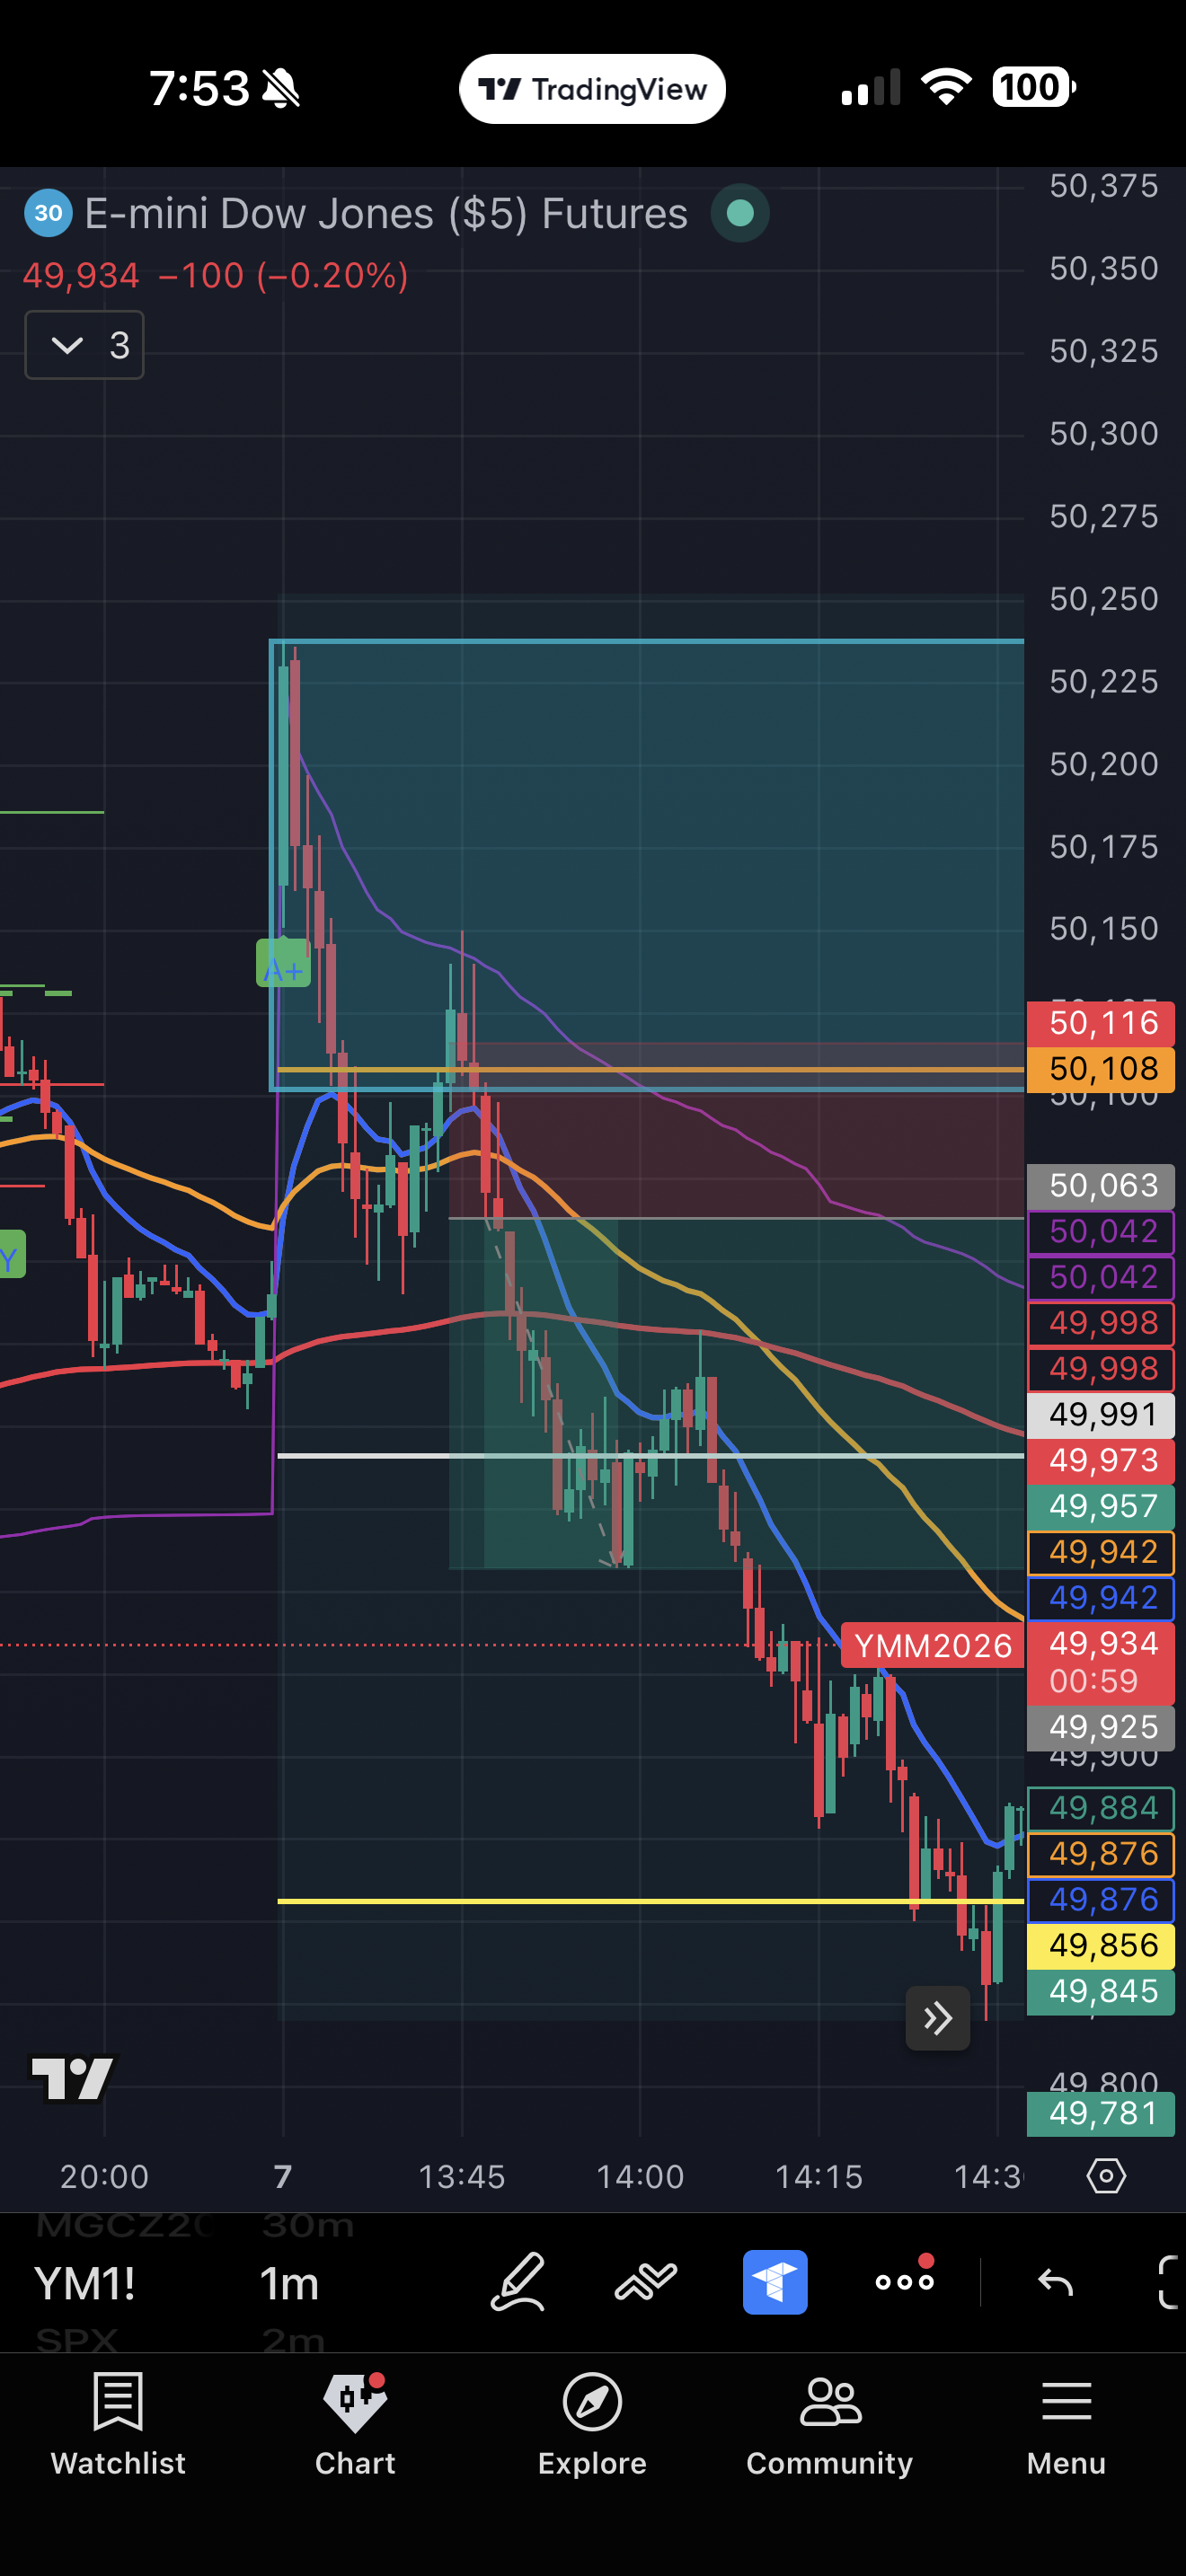
entry
50,063
stop
50,116
target
49,958
R:R
1:2.0
5 minute ORB breakout trade: Strong resistance was identified at the ATH zone between 50,234–50,180, confirmed on the higher time frame. Price showed candles breaking below the 13 EMA across multiple…
A+11 reviews · 100% A+
Sign in to grade